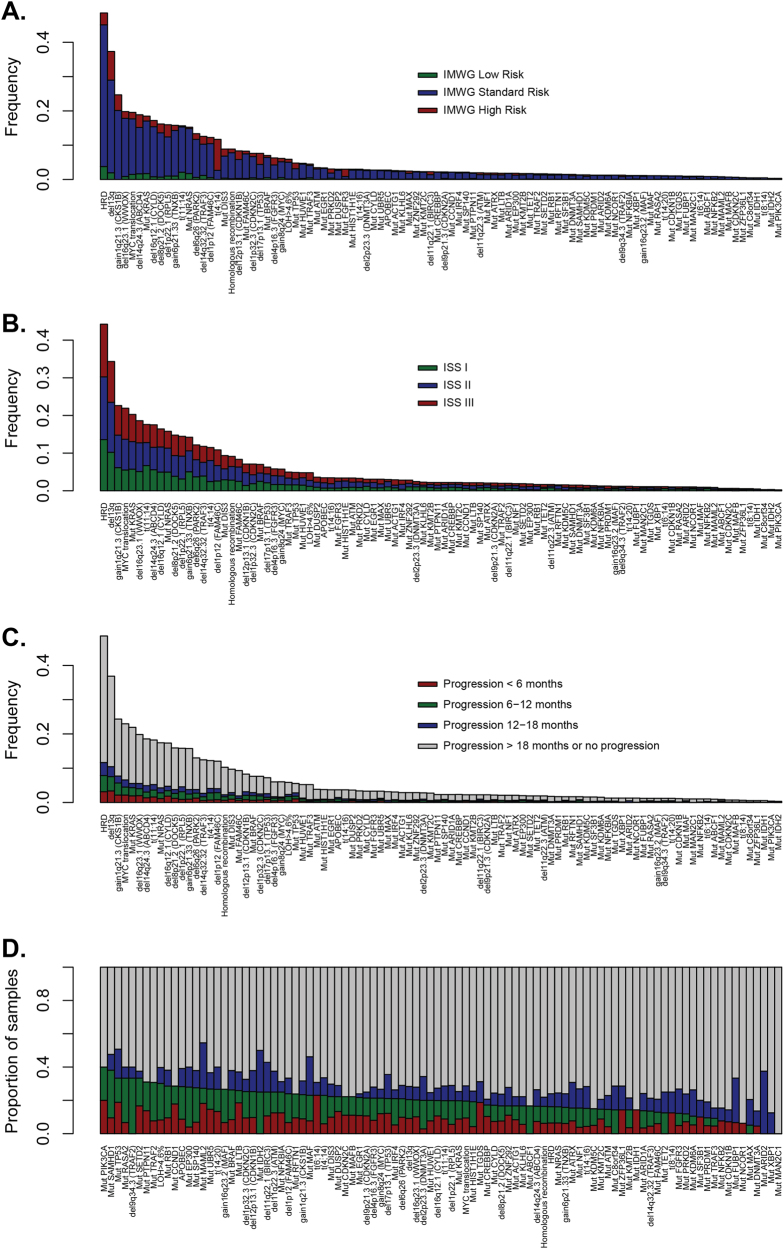
Fig. 2.
The association of myeloma-acquired genetic variants with clinical risk groups. a The distribution of driver mutations, translocations, and copy number alterations by IMWG risk status. It can be seen that a limited number of variables explain a proportion of risk, as would be anticipated based on how the IMWG risk status is assessed, but it can be seen clearly that these variants do not explain a significant amount of variability in clinical outcome. b The distribution of driver mutations, translocations, and copy number alterations by ISS. The distribution shows the independence of ISS from the genetic data, suggesting that a patient’s ISS stage cannot be predicted by mutational diagnosis (and vice-versa); also, that using both could be important for modeling patient outcomes. c Bar plot shows the contribution of each driver variant to relapse, with a breakdown of PFS over <6 months/6–12 months/12–18 months/>18 months, or no progression. Patients with censored follow-up <18 months were excluded from the analysis. d The same data as in plot (c) was only expressed as a proportion, with features sorted by the proportion, of patients who relapsed within the first year of therapy. Differences in rates in early relapse across genetic features suggest a motivation for the inclusion of such features in predictive modeling for poor patient outcome

