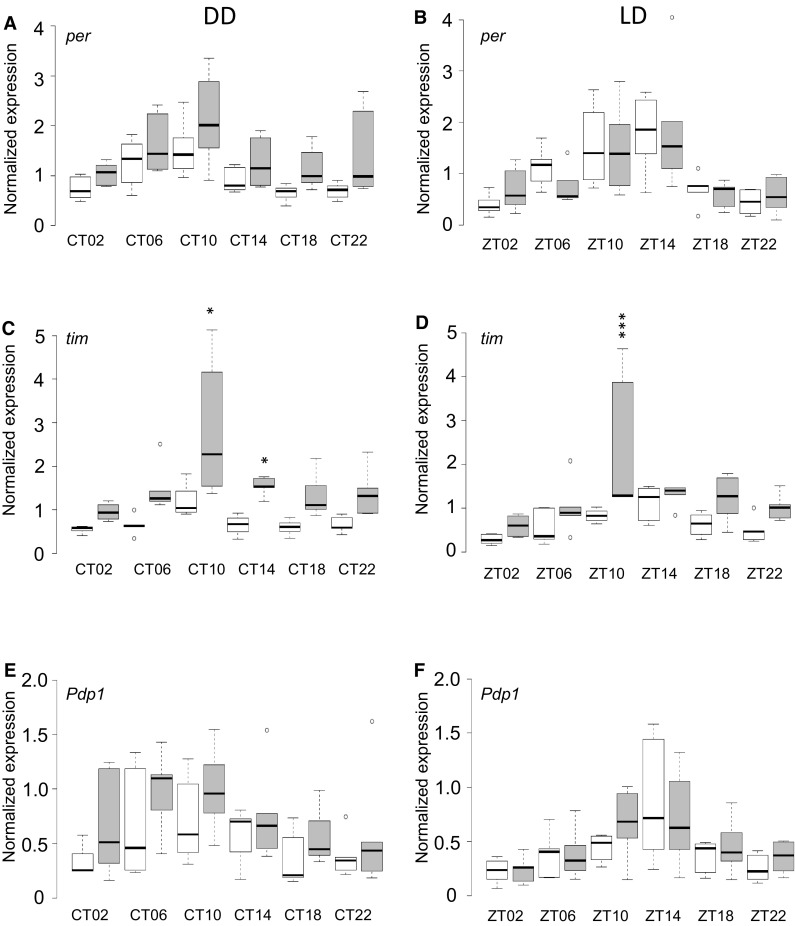
Fig. 3.

Canonical clock gene expression profile of Canton-S B and DGRP_892. Normalized transcript levels are plotted against time for constant darkness (DD) and standard 12-h light:dark (LD) conditions. Canton-S B transcript levels are white; DGRP_892 transcript levels are gray. a, bper. c, dtim. e, fPdp1. CT circadian time, ZT zeitgeber time. Plots show the average of males and females. Significant differences between Canton-S B and DGRP_892 at a given time point are indicated by asterisks. *FDR < 0.05; ***FDR < 0.001. Source data is provided in Table S12
