Fig. 4.

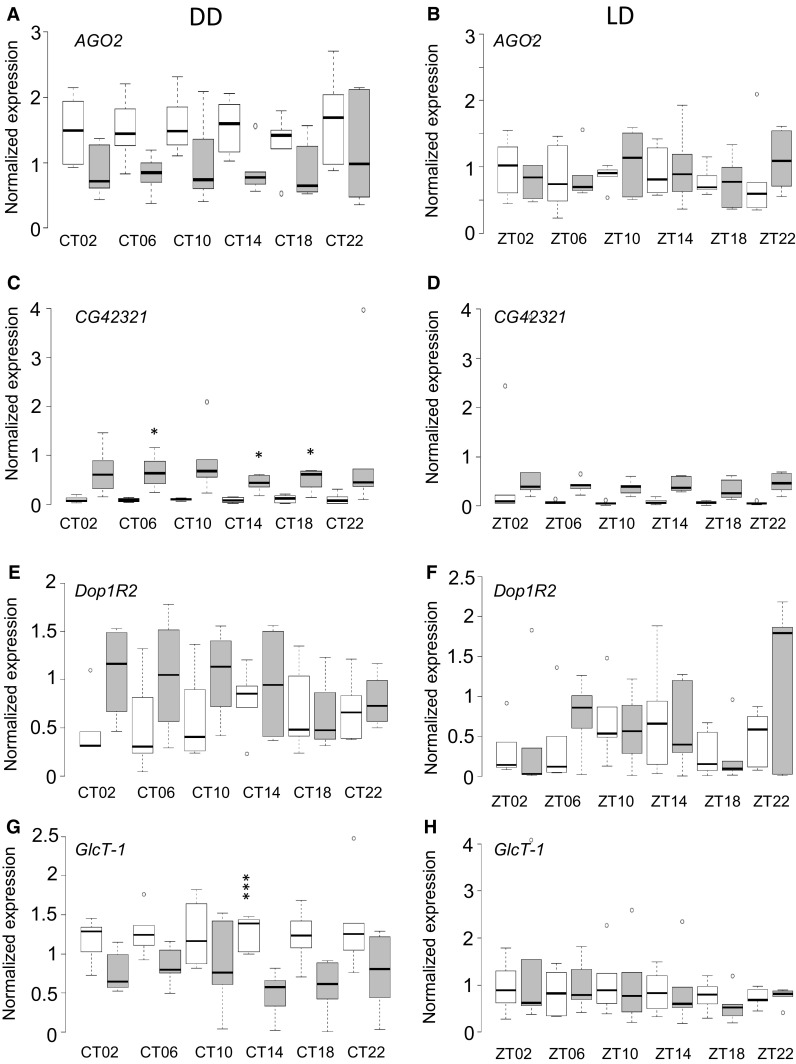
Candidate gene expression profiles of Canton-S B and DGRP_892. Normalized transcript levels are plotted against time as in Fig. 3. a, bAGO2. c, dCG42321. e, fDop1R2. g, hGlcT-1. The remaining genes are plotted in Figure S6

Candidate gene expression profiles of Canton-S B and DGRP_892. Normalized transcript levels are plotted against time as in Fig. 3. a, bAGO2. c, dCG42321. e, fDop1R2. g, hGlcT-1. The remaining genes are plotted in Figure S6