
Fig. 1.
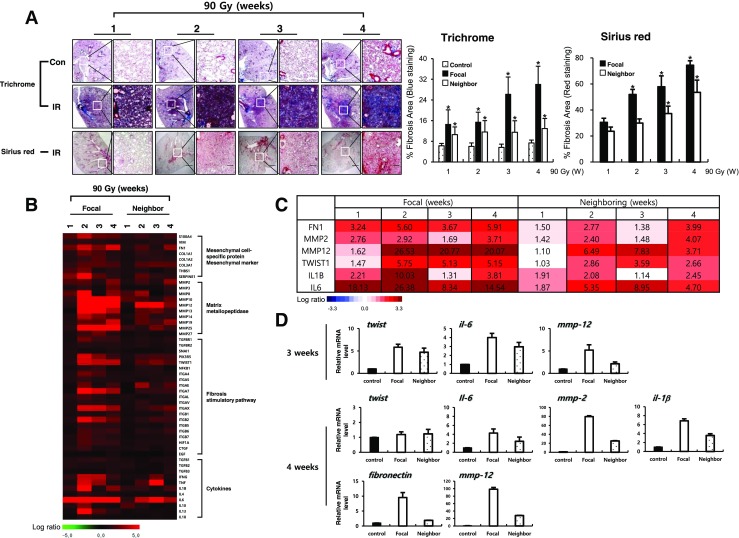
Fibrotic changes of focal and neighboring regions after focal high-dose radiation (90 Gy). a Masson’s trichrome (upper) and Sirius red (bottom) from animals in the non-irradiated control (Con) and irradiated (90Gy IR) groups. Graphs represent quantification of fibrosis score in focal lung regions and neighboring lung regions. The arrows indicate the focally irradiated area. Magnification, × 1.25 and × 100; scale bar, 50 μm (n = 3, mean ± SD, *p < 0.05 vs. compared to the age-matched unirradiated control group (Trichrome), *p < 0.05 vs. compared to the corresponding 1 week group (Sirius red), one-way ANOVA). b Heat-map representing the differentially expressed fibrosis-related genes by focal high-dose radiation in both irradiated and neighboring regions at the indicated time points. Each column represents pooled lung tissue RNA samples from three mice at each time point to exclude experimental bias. The expression ratio color scale ranges from red (high) to green (low), as indicated by the scale bar with log 2 units. c List of fibrosis-related genes with a fold ratio > 2 or < 0.5 (for up and downregulation, respectively) compared to the control. d Quantitative RT-PCR using focal irradiated and non-irradiated neighboring lung tissue from three individual mice at the indicated time points. Each mRNA expression was normalized to gapdh (n = 3, mean ± SD)