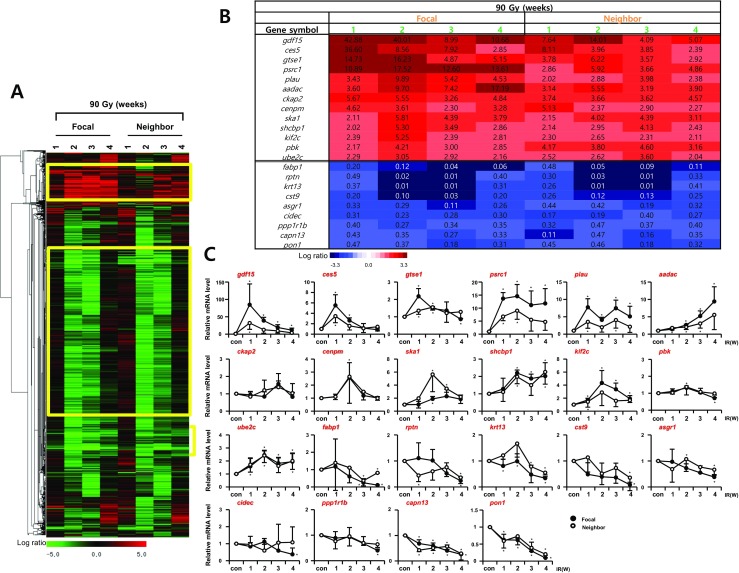
Fig. 3.

Temporal gene expression patterns in focal irradiated and neighboring lung regions by 90 Gy. a Microarray data from mouse lungs were obtained at indicated time points after exposure to 90 Gy. The expression ratio color scale ranges from red (high) to green (low), as indicated by the scale bar with log 2 units. b List of candidate genes with a fold ratio > 2 or < 0.5 (for up and downregulation, respectively) compared to the control. c Confirmation of candidate genes by quantitative RT-PCR using the lungs from three individual mice. Each mRNA expression was normalized to gapdh (n = 3, mean ± SD, *p < 0.05 vs. corresponding control, one-way ANOVA)
