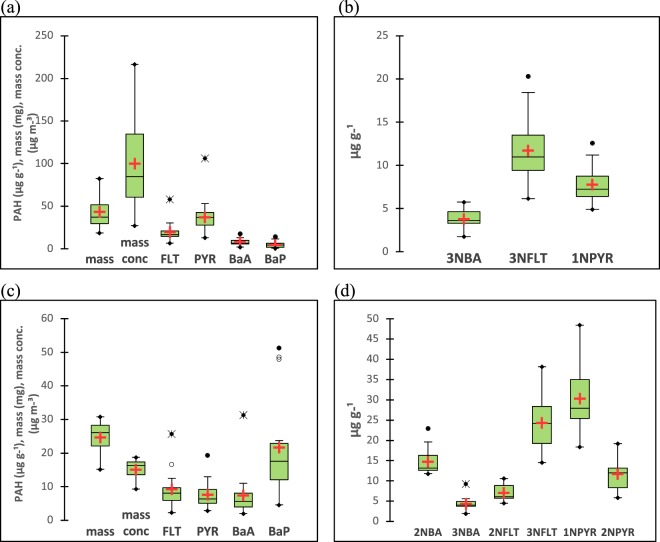
Figure 3.
Box-and-Whisker plots for selected nitro-PAHs and PAHs in PM2.5, (a,b) diesel exhaust directly-emitted levels (bus station) and (c,d) ambient levels (coastal area). In this figure mean values are indicated by the red crosses, central horizontal bars are the medians, and the box lower and upper limits are the 1st and 3rd quartiles, respectively. Open circles and asterisks are outliers and closed circles are minimum/maximum values. The box plot width has no statistical meaning.

