Fig. 3.
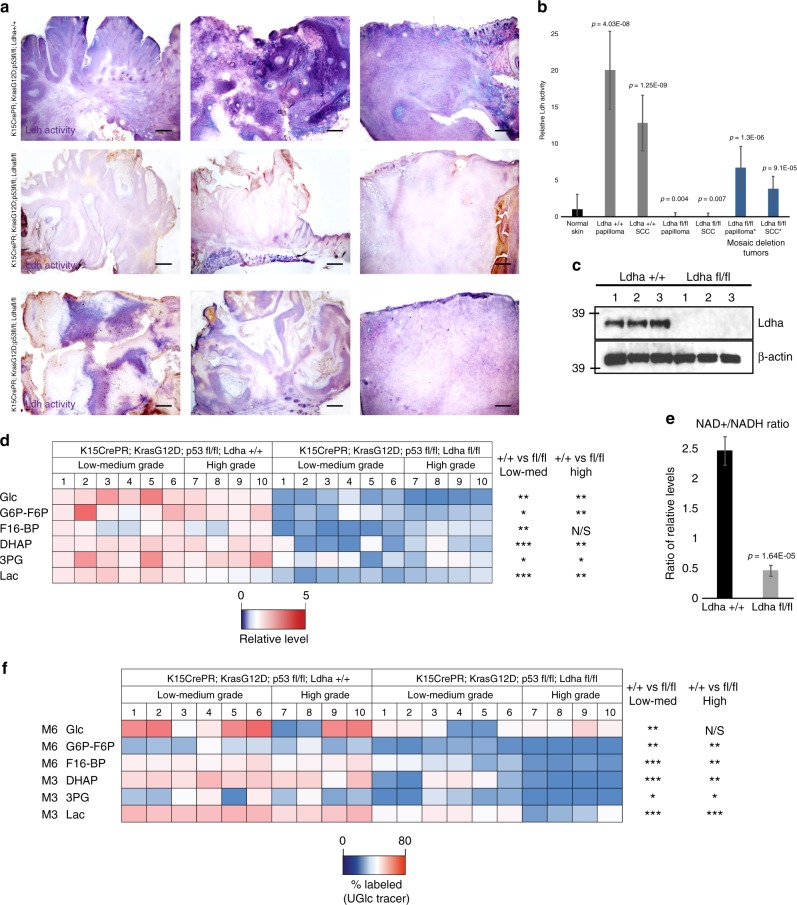
Metabolic effects of loss of Ldha during tumorigenesis. a In situ measurement of maximal Ldh activity in tumors with and without Ldha deletion shows a dramatic loss of activity in most tumors from the Ldha deletion mice (middle row). Activity is indicated by purple color; pink is a nuclear counterstain. In addition, some tumors formed in deletion mice show mosaicism for Ldh activity, presumably due to mosaic deletion of Ldha mediated by CrePR induced recombination. Scale bars, 200 µm. b Ldh activity in lysate derived from tumors of the indicated stages. Those samples with * indicated tumors that were deemed to be mosaic for Ldha deletion by the in situ assay. Each bar represents the average signal for each tumor type where n = 6 mice per tumor stage and genotype from 42 animals. Shown as mean ± SEM. Paired t test was performed, P < 0.05 shown for each tumor type versus control skin. c Western blotting for Ldha protein indicated the effectiveness of the genetic deletion. d Heatmap depicts relative levels of glycolytic intermediates as measured by LCMS in tumors from animals with and without Ldha expression. Each column represents metabolite measurements from an individual animal, and 20 animals were used, 10 of each genotype. e NAD+/NADH ratio in Ldha wild-type (+/+) vs. Ldha null (fl/fl) tumors. Each bar represents the relative NAD+/NADH ratio where n = 10 mice per genotype. Shown as mean ± SEM. Paired t test was performed, P < 0.05 shown for knockout versus wild-type tumors. f Heatmap depicts percentage of glycolytic intermediate isotopomers in tumors with indicated genotypes from animals IP injected with [U-13C6] glucose 15 min prior to tumor harvesting. For (d, f), ∗P < 0.05; ∗∗P < 0.01; ∗∗∗P < 0.001; NS, P > 0.05. Student’s paired t test

