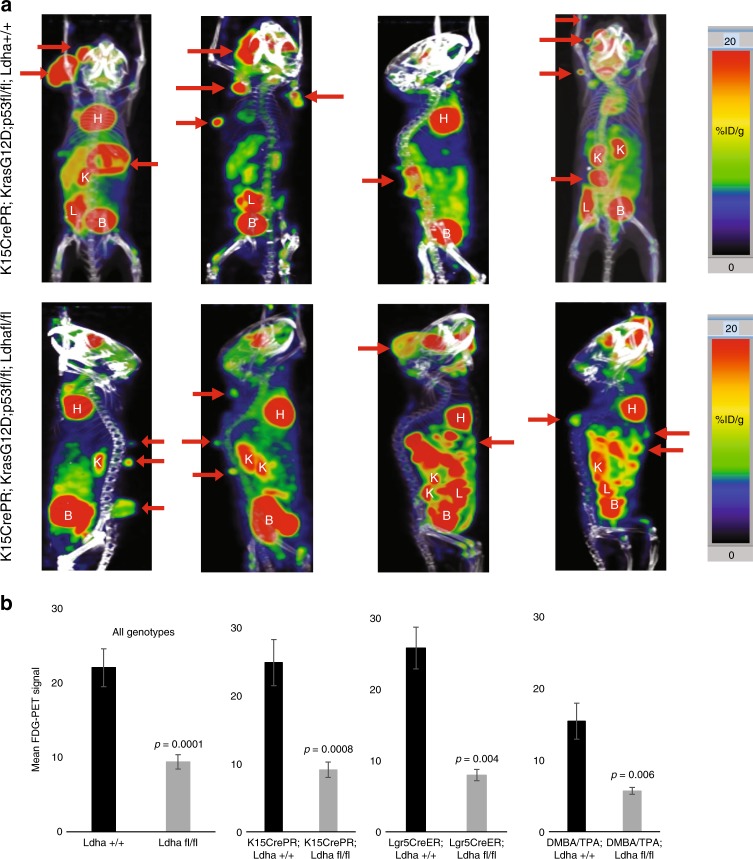
Fig. 4.
Absence of Ldha leads to decreased Glucose uptake in tumors. a Positron Emission Tomography imaging after injection of FDG, a glucose analogue was used to demonstrate the relative degree of glucose uptake across tumors formed in the indicated genotypes. Red coloration indicates a high level of glucose uptake, and further demonstrates that SCC tumors are highly glycolytic. Red arrows indicate tumors. H = heart, K = kidney, L = liver, B = bladder. b Quantification of FDG-PET signal showed that Ldha null tumors (from either K15CrePR, Lgr5CreER, or DMBA/TPA mice) consistently show lower glucose uptake. Each bar represents the mean FDG-PET signal where n = 6 mice per genotype. Shown as mean ± SEM. Student’s paired t test was performed, P < 0.05 shown for knockout versus wild-type tumors

