Fig. 7.
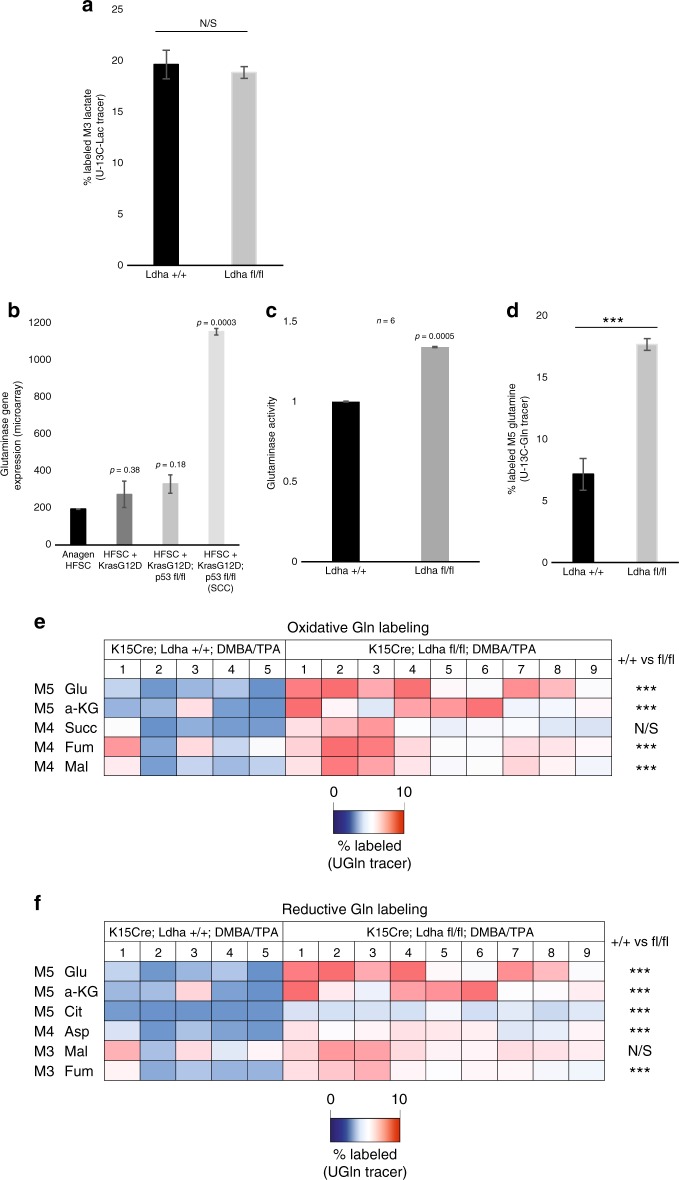
Glutamine uptake and metabolism are elevated Ldha-null tumors. a Percentage of M3 lactate in Ldha +/+ vs. fl/fl tumors from mice injected with [U-13C3]lactate 15 min prior to tumor harvesting and metabolite extraction. Student’s paired t test was performed, ∗P < 0.05; ∗∗P < 0.01; ∗∗∗P < 0.001; NS, not significant; n = 12. b Glutaminase mRNA levels in HFSCs at various stages of tumorigenesis. Each bar represents n = 3 mice per condition. Shown as mean ± SEM. Student’s paired t test is shown for each condition vs. anagen HFSCs. c Glutaminase activity in lysate from wild-type and Ldha-null tumors. Each bar represents the relative glutaminase activity signal for each genotype type, where n = 3 mice per genotype. Shown as mean ± SEM. Student’s paired t test was performed, P < 0.05 shown for wild-type vs. knockout tumors. d Percentage of M5 glutamine in Ldha +/+ vs. fl/fl tumors from mice injected with [U-13C5]glutamine 15 min prior to tumor harvesting and metabolite extraction. Student’s paired t test was performed, ∗P < 0.05; ∗∗P < 0.01; ∗∗∗P < 0.001; NS, not significant; n = 12. e–f Heatmaps depict percentage of TCA cycle intermediate isotopomers in oxidative and reductive glutamine metabolism, respectively, in tumors with the indicated genotypes. Animals were IP injected with [U-13C5] glutamine 15 min prior to tumor harvesting. Student’s paired t-test was performed; ∗P < 0.05; ∗∗P < 0.01; ∗∗∗P < 0.001; NS, not significant; n = 14

