Figure 3.
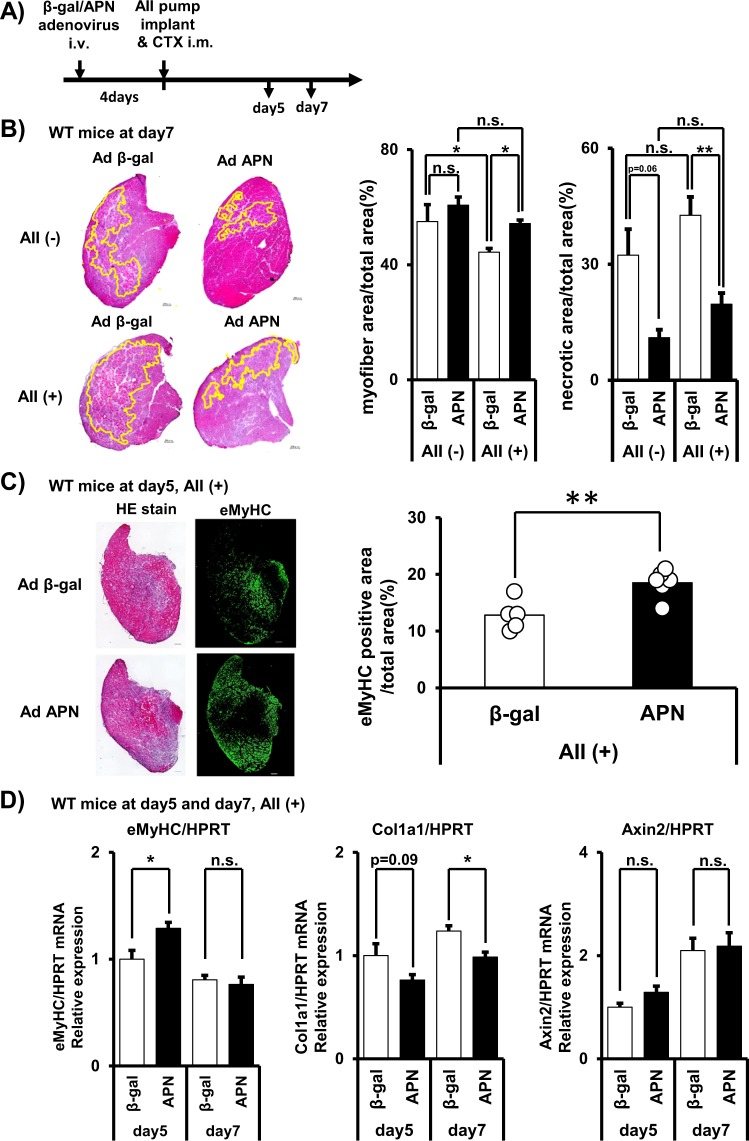
Effect of adiponectin overexpression on muscle regeneration. (A) Overview of the experiment for assessing the effects of adiponectin overexpression on muscle regeneration. (B) Representative H&E staining of tibialis anterior (TA) muscle at 7 days after CTX injection. Scale bars, 200 μm. Myofiber area (%) (myofiber area/total area) was quantified from H&E stains. Residual necrotic region area (%) (necrotic area/total area) was identified and quantified from H&E staining by a method described in Methods. Data are mean ± s.e.m., n = 3 (AII−), n = 6 (AII+), *P < 0.05; **P < 0.01, Tukey’s test. Raw image and identified necrotic region of all sections were in Fig. S3. (C) Immunofluorescent staining of embryonic myosin heavy chain (eMyHC) in WT mice. eMyHC positive myofiber area was quantified and shown in right. (D) mRNA expression of eMyHC, collagen 1a1 (Col1a), and AXIS inhibition protein 2 (Axin2). Data are mean ± s.e.m., n = 5 (day5, APN), n = 6 (others), n.s; not significant; *P < 0.05.

