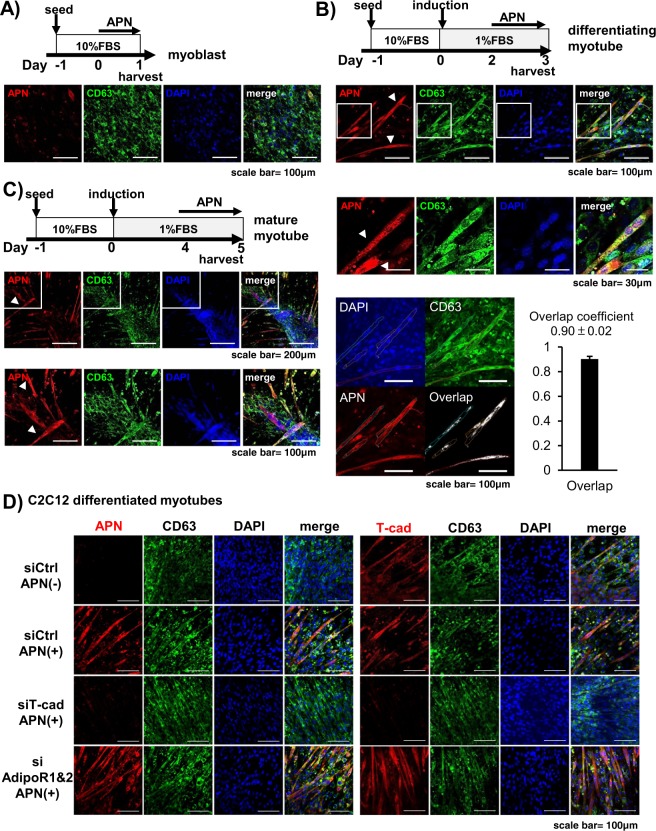
Figure 6.
Intracellular distribution of APN. Confocal immunofluorescence micrographs of C2C12 cells. (A–C) Cells at indicated induction periods were stained with anti-adiponectin (APN; red), anti-CD63 (MVB; green). Cell nuclei were counterstained with DAPI (Nuclei; blue). Scale bars, 100 μm. (A) Undifferentiated C2C12 myoblasts. Scale bars, 100 μm. (B) Differentiating C2C12 myocytes. Scale bars, 100 μm; 30 μm (higher magnifications). Overlap coefficient of APN and CD63 in differentiating myocytes was calculated as described in Methods. Data are mean ± s.d., n = 5. (C) Fully differentiated C2C12 myotubes. arrow heads; differentiating myocytes. Scale bars, 200 μm; 100 μm (higher magnifications). (D) Differentiating C2C12 cells treated with siRNAs. siRNA for T-cad, AdipoR1/AdipoR2 or negative control were transfected into C2C12 cells. Differentiating cells (Day 2) were treated with or without purified adiponectin for 24hrs. Cell nuclei were counterstained with DAPI (Nuclei; blue). Anti-CD63 (MVB; green). Anti-adiponectin (red) for left panels and Anti-T-cadherin (red) for right panels. Scale bars, 100 μm.

