Figure 5.
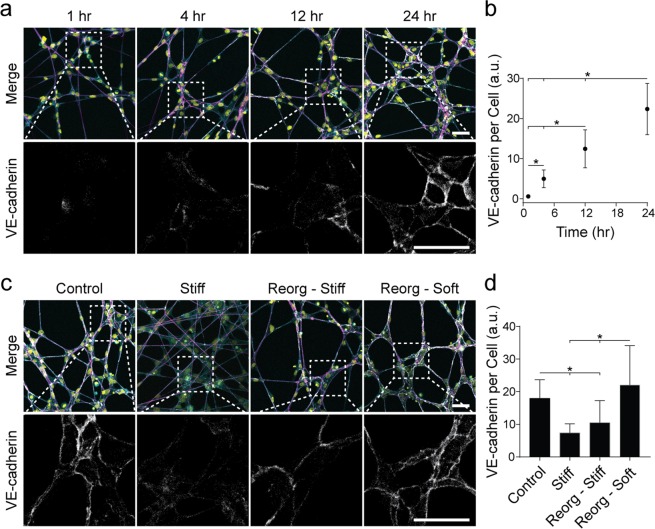
Matrices permissive to physical reorganization and persistent deformations yield EC networks stabilized by VE-cadherin enriched cell-cell junctions. (a) Confocal fluorescence maximum projections of phalloidin-stained ECs (cyan), rhodamine-labeled fibers (magenta), nuclei (yellow), and VE-cadherin (gray) at 0, 1, 4, and 24 h after cell seeding on control DexMA matrices (top row). Dashed boxes indicate locations of higher magnification images depicting VE-cadherin expression at cell-cell junctions (bottom row). (c) Confocal fluorescence maximum projections of phalloidin-stained ECs (cyan), rhodamine-labeled fibers (magenta), nuclei (yellow), and VE-cadherin (gray) of samples 24 h after seeding on control and stiff DexMA matrices, on control matrices cultured for 24 h, lysed, crosslinked, and then reseeded for 24 h (Reorg – Stiff), or on control matrices cultured for 24 h, lysed, and then reseeded for 24 h (Reorg – Soft) (top row). Dashed boxes indicate locations of higher magnification images depicting VE-cadherin expression at cell-cell junctions 24 h after cell seeding (bottom row). (b,d) Quantification of total VE-cadherin fluorescent intensity normalized to cell density at each timepoint (b) and matrix condition (d). Scale bars: 50 μm. All data presented as mean ± std; n ≥ 16; *P < 0.05.

