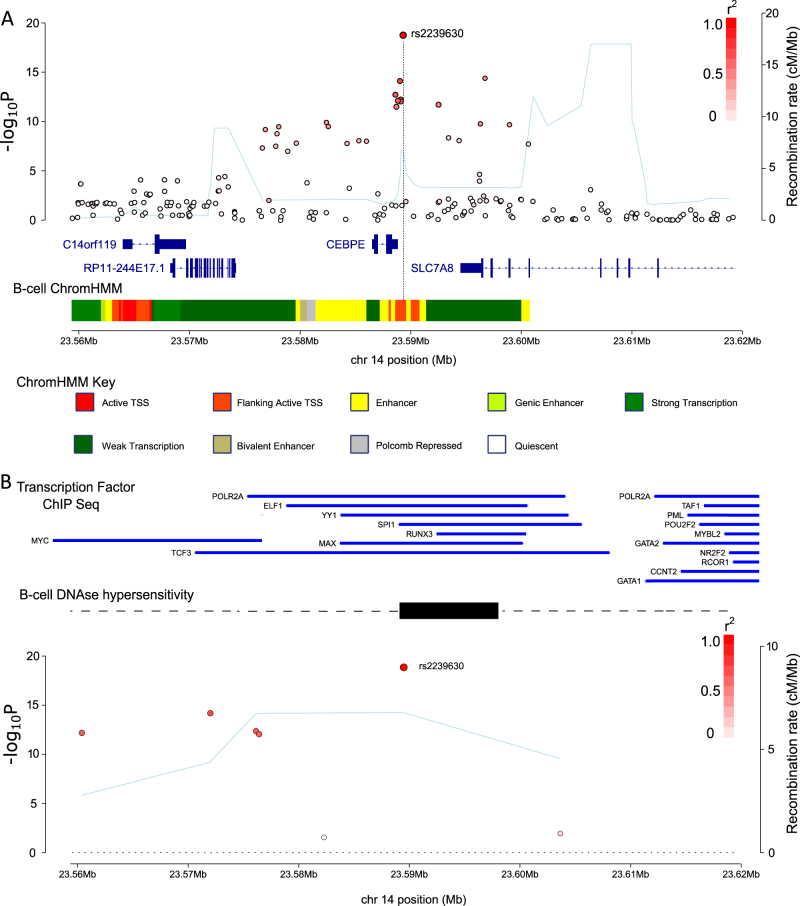
Fig. 1.
Regional association plot for 14q11.2. a and b show SNPs (red circles) plotted by GWAS P-values (−log10, y-axis) and location (x-axis, GRCh37/hg19). Recombination rate (cM/Mb) light blue line (y-axis). SNP colour denotes linkage disequilibrium with the lead SNP, (r2 = 0, white, r2 = 1.0, dark red). a Association plot annotated with genes from Gencode v27. Multicolour bar shows B-cell chromatin states from ChomHMM. b Association plot of SNPs within 1 kb of the lead SNP. Blue lines denote transcription factor ChIP-Seq peaks. Black bar, B-cell DNAse hypersensitivity peak

