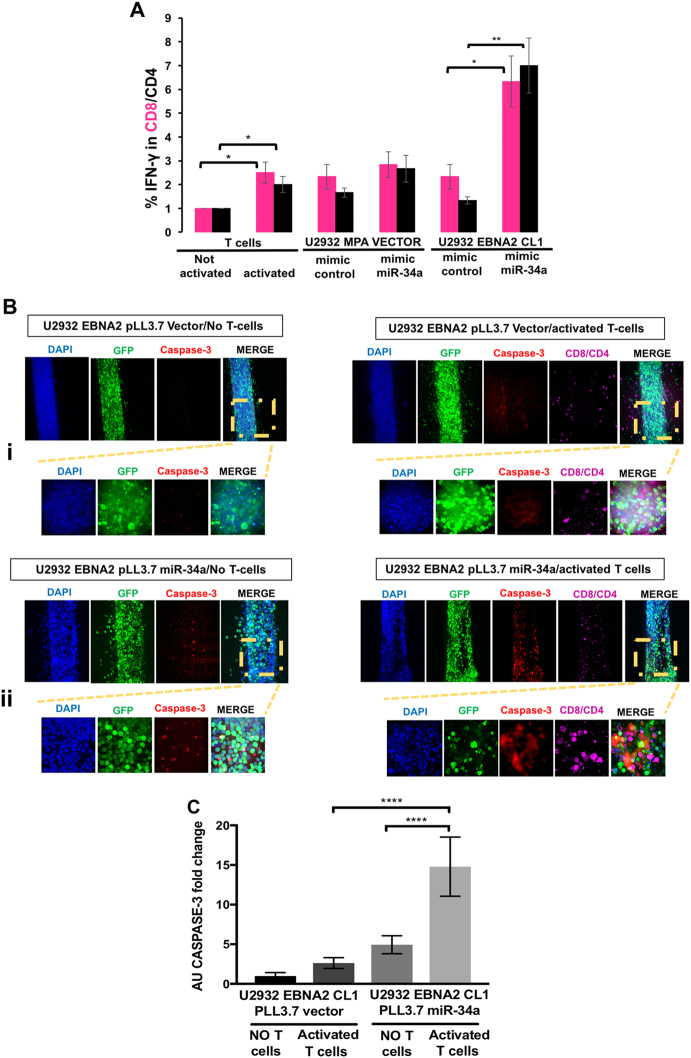
Fig. 6.
miR-34a relieves suppression of immunogenicity induced by EBNA2 as measured in MLR and 3D biomimetic microfluidic coculture devices. a T cells were activated in plates coated with anti-CD3/anti-CD28 antibodies for 72 h. Irradiated targets U2932 MPA vector and U2932 EBNA2 cl-1 were cocultivated with activated T cells (effector). The effector-target ratio was 1:10. The target cells were transfected with mimic control or miR-34a mimic 24 h prior to cocultivation with the effector cells. The coculture was carried out for 48 h and the cells were stained for CD4/CD8 and IFN-γ and processed for flow cytometry. Data are expressed as mean ± SD. The p values for T-cell activation without stimulators are (*) p ≤ 0.05 for CD8 and CD4. In MLR with U2932 stimulators, the statistical significance is (*) p = 0.028 for CD8 and (**) p = 0.0081 for CD4. Three different experiments were performed with PBMCs isolated from three different donors. b Three-dimensional biomimetic microfluidic coculture devices: Four million/ml U2932 EBNA2 cells tranduced with lentiviral vector controls were introduced into the microfluidic devices. In coculture experiments (right panel in b), devices were first seeded with U2932 EBNA2 cells and were incubated for 24 h at 37 °C, followed by activated T cells seeding. Immunostaining was performed after 48 h of cocultivation. bi: Representative confocal images of U2932 EBNA2 cl-1 transduced with GFP-lentiviral vector control in the absence or presence of activated T cells; bii Four million/ml U2932 EBNA2 cl 1, tranduced with miR-34a lentivirus, were introduced in the collagen/fibronectin devices either alone (left panel) or cocultivated with previously activated T cells (right panel). The cocultivation of target, miR-34a transduced U2932 EBNA2 cells with activated T cells, was carried out for 48 h before immunostaining. miR-34a containing lentivirus-transduced U2932 EBNA2 cl-1 cells were stained with anti-GFP antibody (green), activated CD8/CD4 T cells were stained with anti-CD8 and anti-CD4 (magenta), apoptotic U2932 EBNA2 cl-1 cells were visualized with anti-caspase-3 antibody (red), and nuclei were counterstained with DAPI (blue). The overlap of miR-34a transduced U2932 EBNA2 cells (GFP positive) and caspase-3 (red) indicates tumor cell death (merged images, yellow). Scale bar = 100 μm, magnification of the insets = scale bar 20 μm. c Arbitrary Caspase-3 units were calculated for each experimental condition. Statistically significant caspase-3 positive cells were observed only in miR-34a tranduced EBNA2 expressors; Data expressed as mean ± SEM; (****) p < 0.0001. N = 4 fields (3–4 devices for each experimental condition). Shown is one representative experiment out of four performed. Statistical analysis was performed with Prism-7 software using unpaired T test

