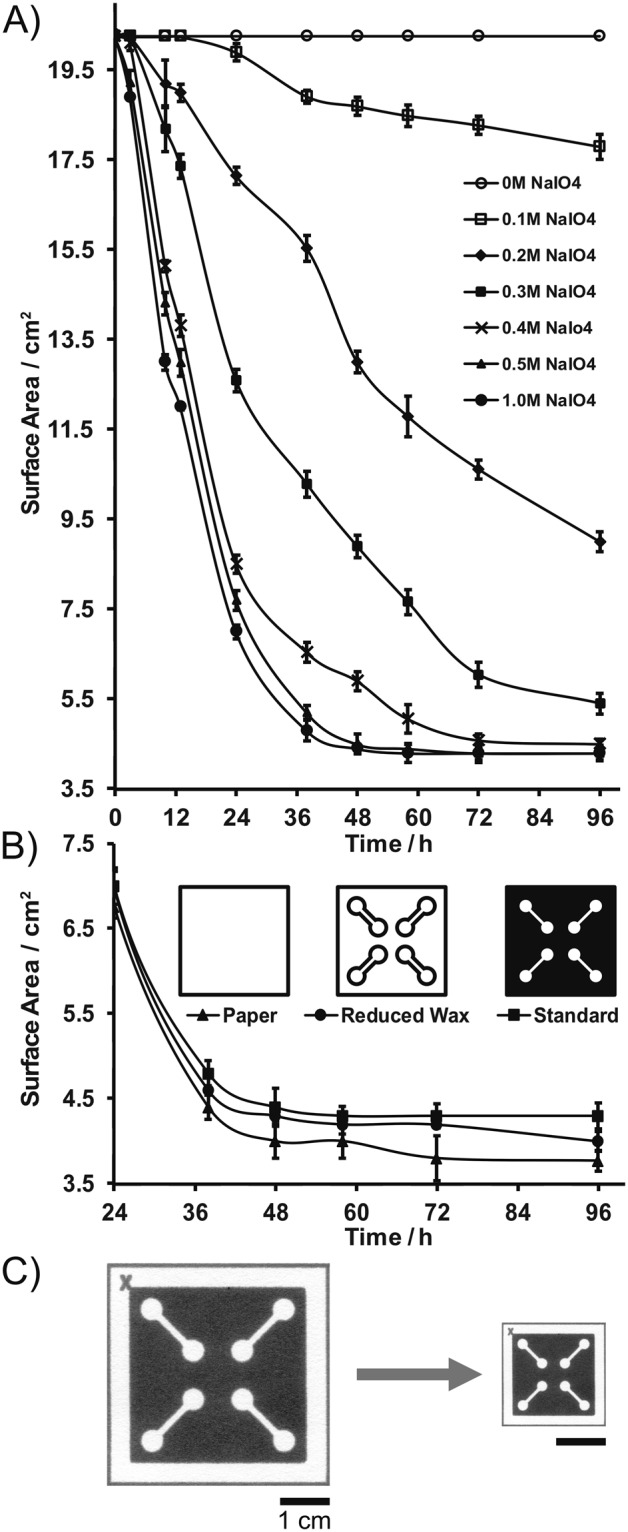
Figure 3.

Miniaturization of microPADs over time. (A) Plot of microPAD surface area versus reaction time for various concentrations of aqueous sodium periodate (NaIO4). (B) Miniaturization comparisons of: non-patterned chromatography paper, microPADs with channel outlines (reduced wax), and microPADs with a full wax background (standard) in 0.5 M NaIO4. Non-patterned chromatography paper displayed the greatest amount of miniaturization, albeit to a minor degree. For both plots, data points represent the mean of three replicates, and error bars represent one standard deviation from the mean. (C) Photograph of miniaturized microPAD (~78% reduction in surface area).
