Fig. 4.
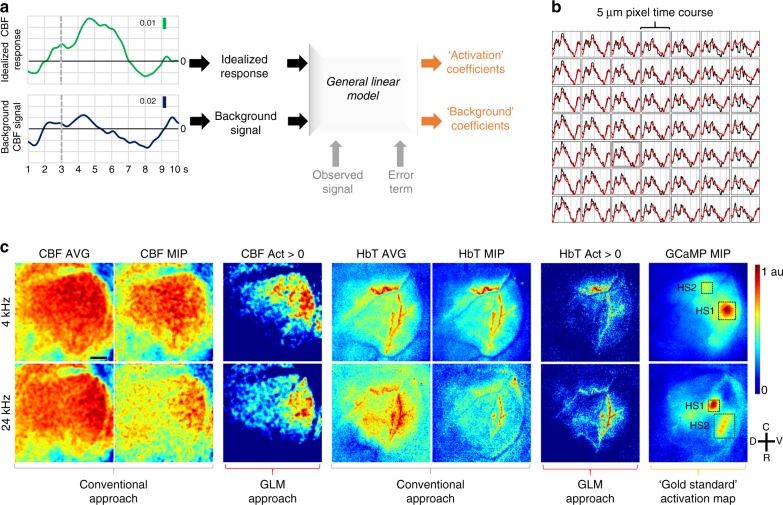
Wide-area functional mapping analogous to stimulus-based fMRI. a Schematic of the image processing pipeline. The idealized response and the background signal were used as regressors to compute the activation and background coefficients from observed time courses using a general linear model (GLM). b AFNI screenshot showing pixel-wise CBF time courses and their corresponding model fits (black: observed CBF response, red: model fit) over a 7 × 7 pixel area. c CBF and HbT average (3–7s), maximum intensity projected (3– 7 s) (MIP) and positive activation coefficient (Act) maps for 4 and 24 kHz stimuli. GCaMP MIPs were employed as the gold standard. All maps were normalized to 0.1%. Two GCaMP hot-spots (HS1 and HS2) are marked on each GCaMP map. One can see that the positive CBF and HbT activation coefficient maps exhibit more tonotopic specificity to the GCaMP signal (i.e., neural activity) than the average or maximum intensity projected CBF and HbT maps. Data presented is an average over 30 trials from a single animal and scale bar indicates 500 μm

