Fig. 5.
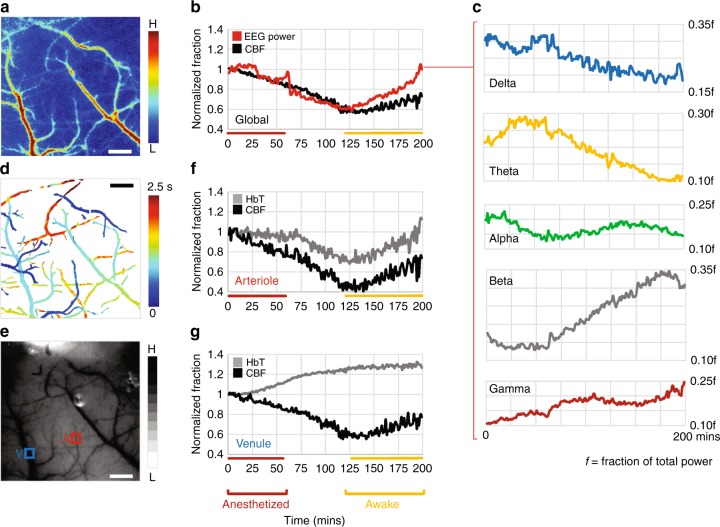
Synchronized multi-contrast imaging and EEG during anesthesia recovery. a Map of the average CBF over the duration of the experiment. b Fluctuations in global EEG power and CBF are correlated. The anesthetized and awake phases are indicated by colored bars. c Plots of the power in EEG sub-bands showing how each varied during recovery from anesthesia. The post-script ‘f’ depicts the power of each sub-band as a fraction of the total EEG power. d Pseudocolored map illustrating the differences in arrival time of an intravenously injected fluorescent tracer (dextran-FITC). Arrival times of the fluorescent tracer are scaled for visualization purposes within the FoV. e IOS map acquired under green light illumination showing HbT absorption for the same FoV. An arteriole (A) and venule (V) are identified in the FoV. f, g Time-series illustrating HbT (i.e., CBV) and CBF fluctuations within the arteriole and venule identified in e. Data presented is from a single animal and scale bar indicates 500 μm. Also see Supplementary Table 2

