Fig. 7.
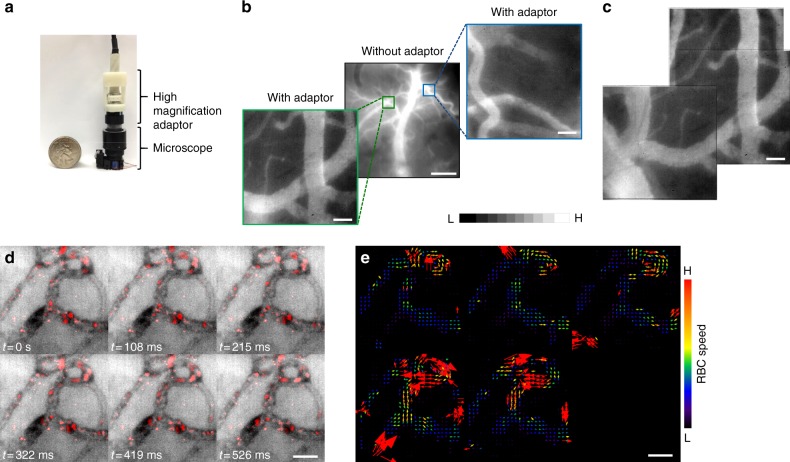
3D printed high-magnification adapter reveals microvascular hemodynamics. a The microscope is shown with the 3D printed high-magnification adaptor alongside a U.S. quarter coin for scale. b Image of fluorescent dye enhanced cortical vasculature ROI. Insets are magnified fields of view from this ROI. c High-magnification mosaic stitched together from three different fields of view. Images in b, c are normalized to 1% of their intensity ranges. d Video frames from a fluorescent-dye enhanced vessel plexus from the mouse ear in which the RBCs have been highlighted in red. One can clearly visualize the motion of individual RBCs over time in each vessel segment, from which one can conduct particle velocimetry and compute the direction and magnitude of RBC flux as shown in e. Cortical and ear microvascular data presented are from two different animals, respectively. Scale bar indicates 50 μm, except in b: where it is 500 μm. Arrows indicate vessel sprouting during D6-D11. Also see Supplementary Movie 7

