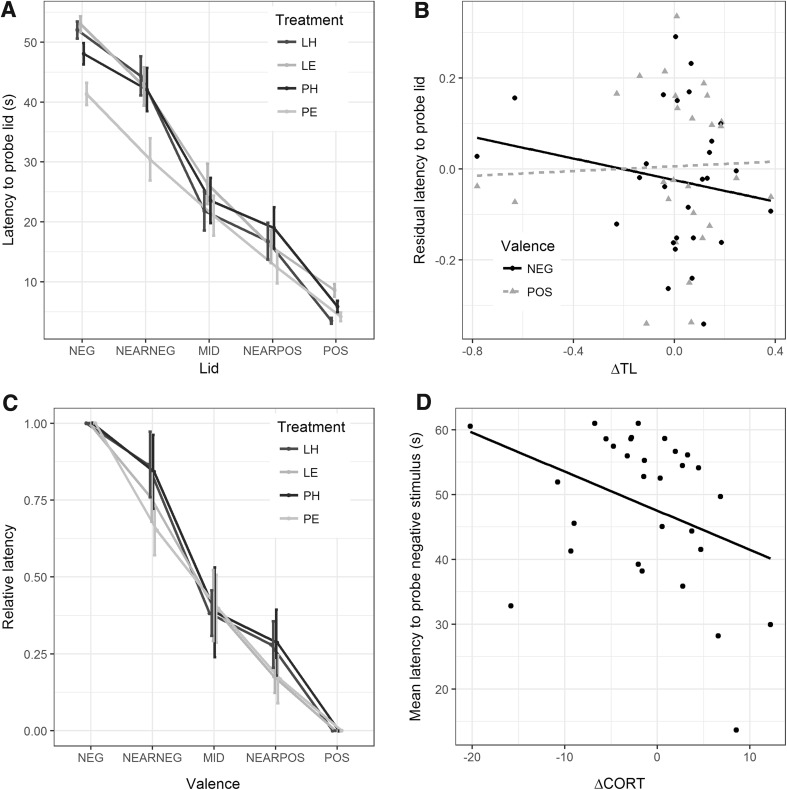
Fig. 2.
Summary of main results. a Mean latencies to probe all stimuli during the test phase, by developmental treatment group. Error bars represent between-bird standard errors. b Residual latency to probe learned stimuli, after controlling for developmental treatments, against developmental telomere change (ΔTL), by valence of stimulus. Note that each bird appears twice on this figure, represented by their mean residual latency to probe the positive stimulus, and their mean residual latency to probe the negative stimulus. c Mean latencies to probe stimuli relative to mean latency to probe the negative stimulus (represented as 0) and mean latency to probe the positive stimulus (represented as 1), by developmental treatment group. The formula for the relative latency to probe the ambiguous stimuli is RL = (latency − mean NEG)/(mean POS − mean NEG), where mean NEG is that bird’s mean latency to probe NEG and mean POS is that bird’s latency to probe POS. Error bars represent between-bird standard errors. d Mean latency to probe negative learned stimulus against ΔCORT. Each data point represents a bird, and the line represents a simple linear fit

