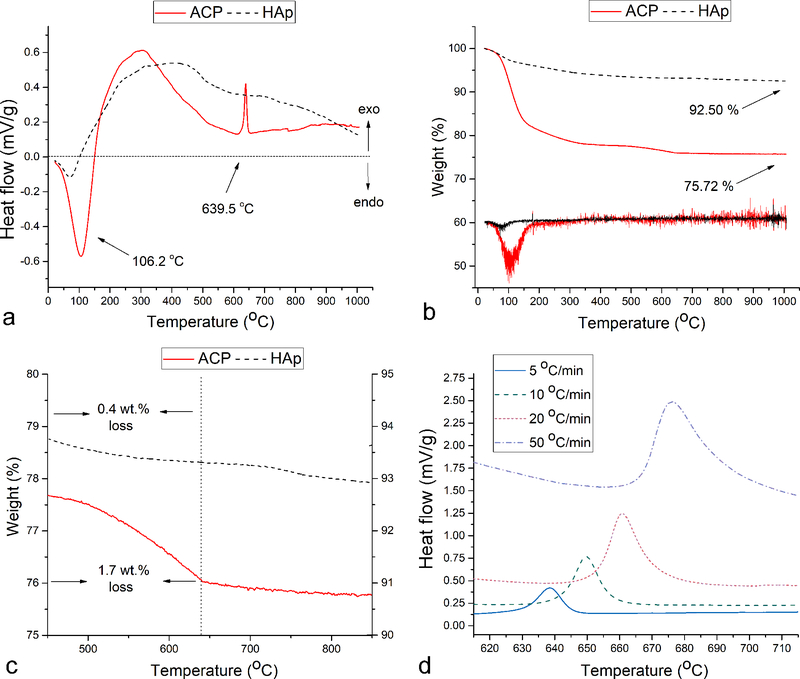
Fig.4.
DTA (a) and TGA (b) diagrams obtained by heating ACP and HAp powders separately up to 1000 °C at the rate of 5 °C/min. Differential TGA curves in (b) are not plotted to scale. TGA diagrams showing the weight loss in the 450 – 640 °C region (c) and DTA diagrams showing the exothermic HAp crystallization peak in the 615 – 715 °C region recorded at the heating rates of 5, 10, 20 and 50 °C/min (d).

