Fig. (1).
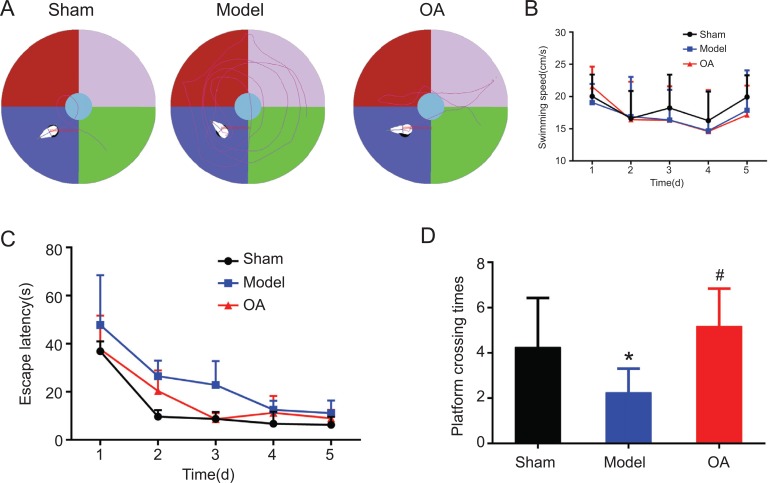
Results of Morris water maze test(n=15). (A) Swimming paths of rats in each group in the Morris water maze. (B) Average swimming speed of rats in each group. Repeated measurement ANOVA results showed that there was no significant difference of the average swimming speed in each group(F=0.331, P = 0.721>0.05) (C) Escape latency time of rats in each group. Post Pairwise Comparisons using Bonferroni method showed that the latency time in model group was significantly longer than that in sham operation group (P=0.0001<0.05); while it was significantly shorter in the OA group than that in model group (P=0.0001<0.05) (D) platform crossing times of rats in each group. Post comparison with LSD method showed that compared with sham group, the times of cross-platform in model group significantly decreased (P = 0.007 <0.05); while compared with model group, the times of cross-platform in OA group significantly increased (P = 0.0001 <0.05).
Notes:*indicates compared with that in the sham operation group, P<0.05.
#indicates compared with that in the model group, P<0.05.

