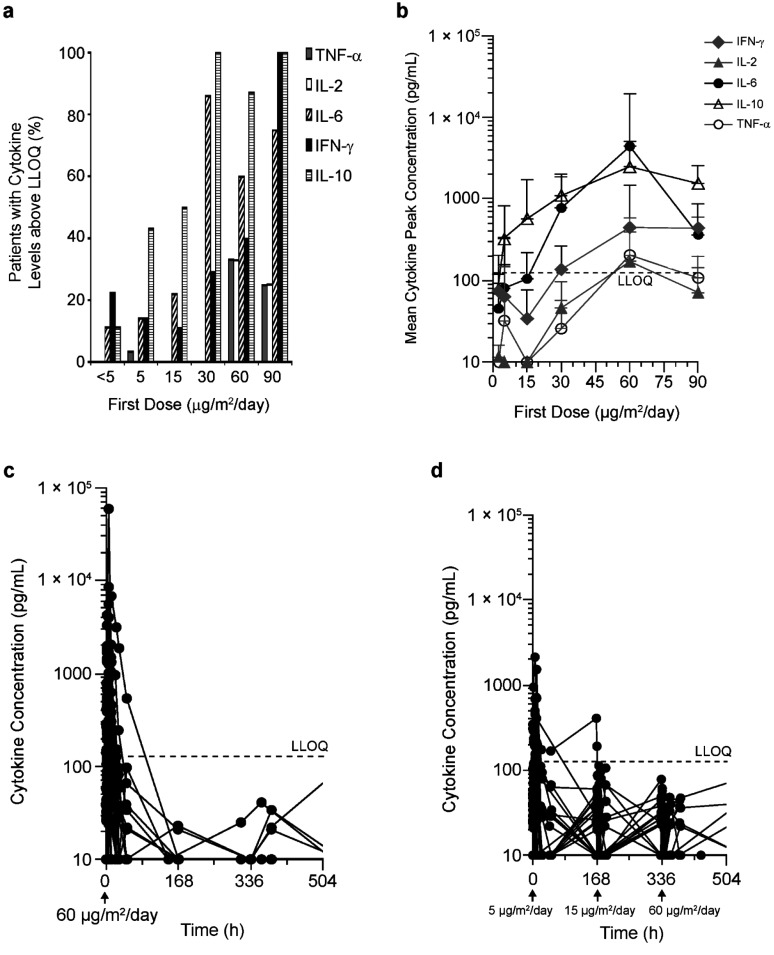
Fig. (4).
a) Proportion of patients with serum cytokine levels above the lower limit of quantification (LLOQ) after blinatumomab infusion start. Number of patients per first dose level: <5 µg/m2/day, n=9; 5 µg/m2/day, n=35; 15 µg/m2/day, n=18; 30 µg/m2/day, n=7; 60 µg/m2/day, n=15; 90 µg/m2/day, n=4. b) Cytokine Cmax (mean SD) in the first week of treatment as a function of blinatumomab dose. Number of patients per first dose level: <5 µg/m2/day, n=9; 5 µg/m2/day, n=35; 15 µg/m2/day, n=18; 30 µg/m2/day, n=7; 60 µg/m2/day, n=15; 90 µg/m2/day, n=4. Data below LLOQ were included as such into the analysis; data below LOD were set at 10 pg/mL (ie, ½LOD). c) Cytokine profiles after continuous IV blinatumomab doses of 60 µg/m2/day throughout treatment (n=9); elevation of cytokines was transient and declined quickly during infusion. d) Cytokine time profiles after stepwise blinatumomab dosing of 5‒15‒60 µg/m2/day (n=21); elevation of cytokines was transient and did not increase with increasing dose. Cmax observed peak concentrations, IFN interferon, IL interleukin, LLOQ lower limit of quantitation, TNF tumor necrosis factor.

