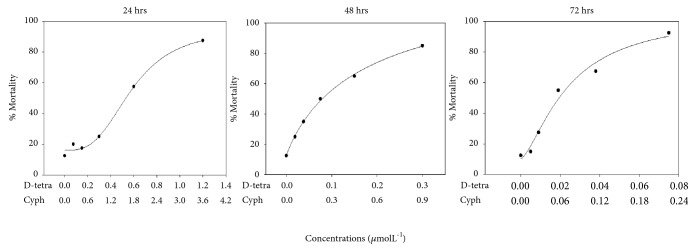
Figure 1.
Graphical representation of % mortality of zebrafish embryos against different concentrations at 24, 48, and 72 hour time intervals. The curves were fitted into 4-parameteric sigmoidal hill curve using SigmaPlot 14 software. Mean values of percentage mortality of two different experiments were plotted against concentrations. 0% is minimum value and 100% is maximum value.

