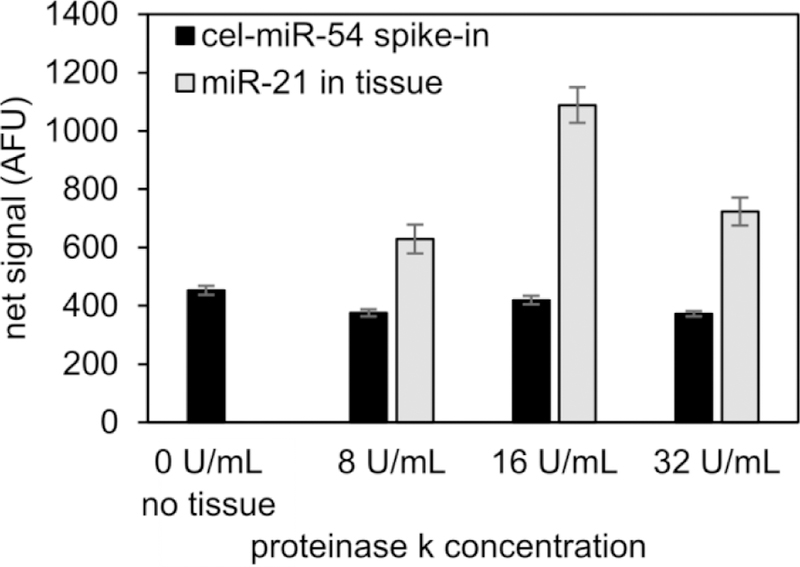
Figure 4:

Optimization of proteinase K in tissue assay. Signal of miR-21 (present in tissue) shows the effects of proteinase K on amount of miRNA released from tissue and measured by microparticles, while signal of cel-miR-54 (not present in tissue) shows the effects of proteinase K and tissue on miRNA assay performance. Error bars = 1 standard deviation.
