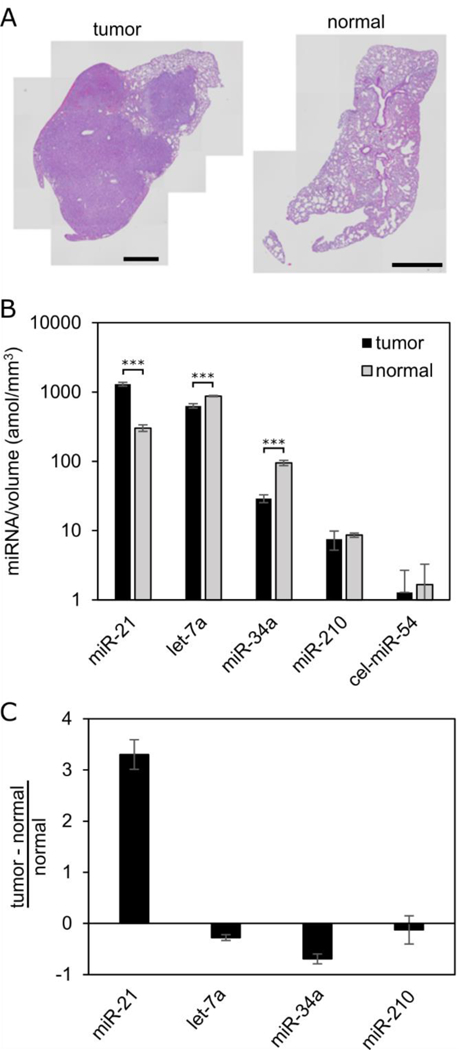
Figure 5:

Comparison of normal and tumor tissue sections with multiplexed miRNA assay. (A) H&E stains of the paired tumor (left) and normal (right) tissue sections in the same mouse from the K-ras; p53 genetically engineered mouse model of non-small cell lung cancer. Scale bars 1 mm. (B) MiRNA signal normalized by volume of tissue for miR-21 (oncogenic miRNA40), let-7a and miR-34a (tumor suppressing miRNAs2,43), and miR-210 (hypoxia marker44). *** indicates P < .001 from two sample t-test. (C) Normalized differential miRNA signal between tumor and normal tissue. Cel-miR-54 is quantified as a negative control. Error bars = 1 standard deviation.
