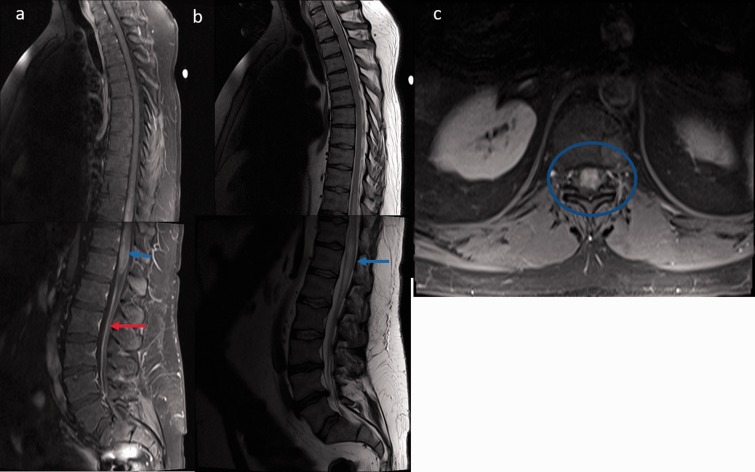
Figure 3.
Spinal cord magnetic resonance imaging displaying lesions in spinal cord sarcoidosis: (a) Sagittal T1-weighted post-contrast imaging of whole spine revealed intramedullary gadolinium enhancement in the dorsal (T10–T12) and conus region (blue arrow) with diffuse leptomeningeal enhancement along the cauda equina (red arrow); (b) Sagittal T2-weighted image displaying heterogeneous cord hyperintensities with edema (blue arrow); (c) Axial T1-weighted post-contrast image shows panmedullary cord involvement (blue circle).

