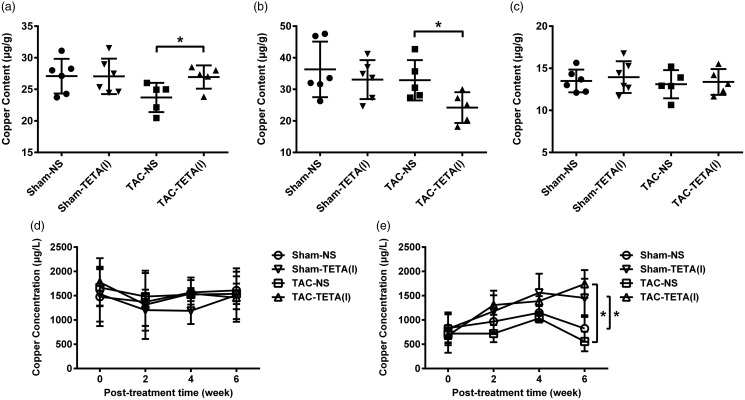
Figure 3.
Changes in copper distribution in the heart and extracardiac tissues after treatment with a lower dose (21.9 mg/kg day) TETA for six weeks. (a) Heart, (b) kidney, (c) liver, (d) blood plasma, and (e) urine. Data are presented as mean ± SD, n = 5–9, *P < 0.05. NS: normal saline; TAC: transverse aortic constriction; TETA: triethylenetetramine.

