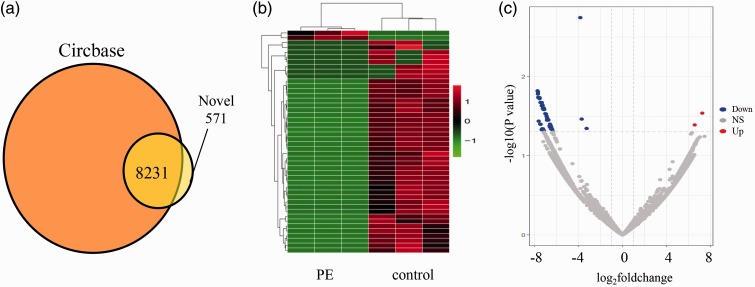
Figure 1.
Differentially expressed circRNA in PE and control group. (a) The obtained circRNAs were compared with the circRNAs in the known database. (b) Heat map presentation of the expression profiles of the circRNAs. Each row represents one circRNA, and each column represents one sample. Red color indicates up-regulation, green indicates downregulation. (c) Differentially expressed circRNAs were displayed by Volcano plots. Gray dots indicated circRNAs with no significant difference. Red dots indicated significant up-regulated circRNAs, blue dots indicated significant down-regulated. NS: Not significant. (A color version of this figure is available in the online journal.)

