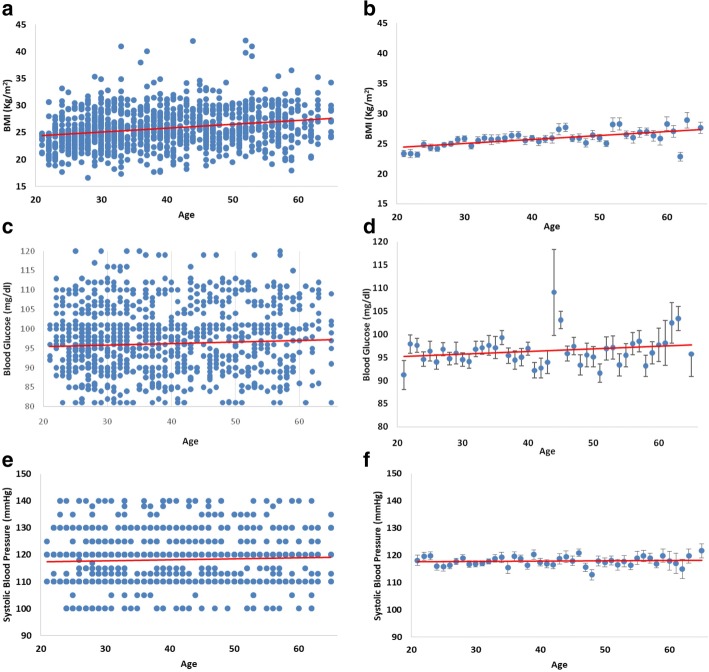
Fig. 2.
a Scatterplot of body mass index (BMI Kg/m2) values by age of subjects examined. b Mean ± S.E.M of BMI values for age. c Scatterplot of blood glucose (mg/dl) values by age of subjects examined. d Mean ± S.E.M of blood glucose values for age. e Scatterplot of systolic blood pressure (mmHg) values by age of subjects examined. f Mean ± S.E.M of systolic blood pressure values for age

