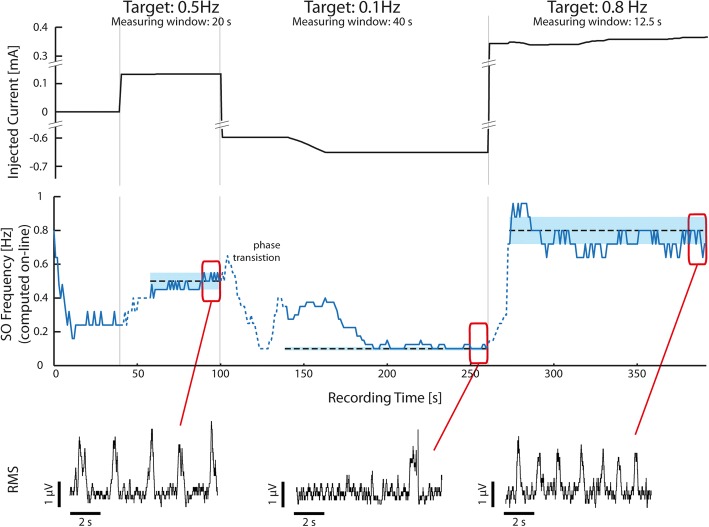
Fig. 5.
A closed-loop run. Recording (400 s) from the closed-loop part of the protocol. Top panel: black trace represents the applied current. Central panel: blue trace represents the online measure of the SO frequency. The line is dashed during the transition phase. The fine-tuning closed-loop phases start soon after the transition phase. Dashed black lines represent the desired target frequency levels (0.5, 0.1 and 0.8 Hz). Around the target frequency, the blue shade represents the tolerance range, that was set at 10% of the target frequency (0.01 Hz, 0.05 Hz and 0.08 Hz respectively). MUA traces are shown for the last 10 s of each target phase. Bottom panel: three sections of the recording illustrating the expanded areas indicated. Each section illustrates one of the reached oscillatory frequencies. SO, slow oscillations; RMS, voltage root mean square to identify occurrence of SO

