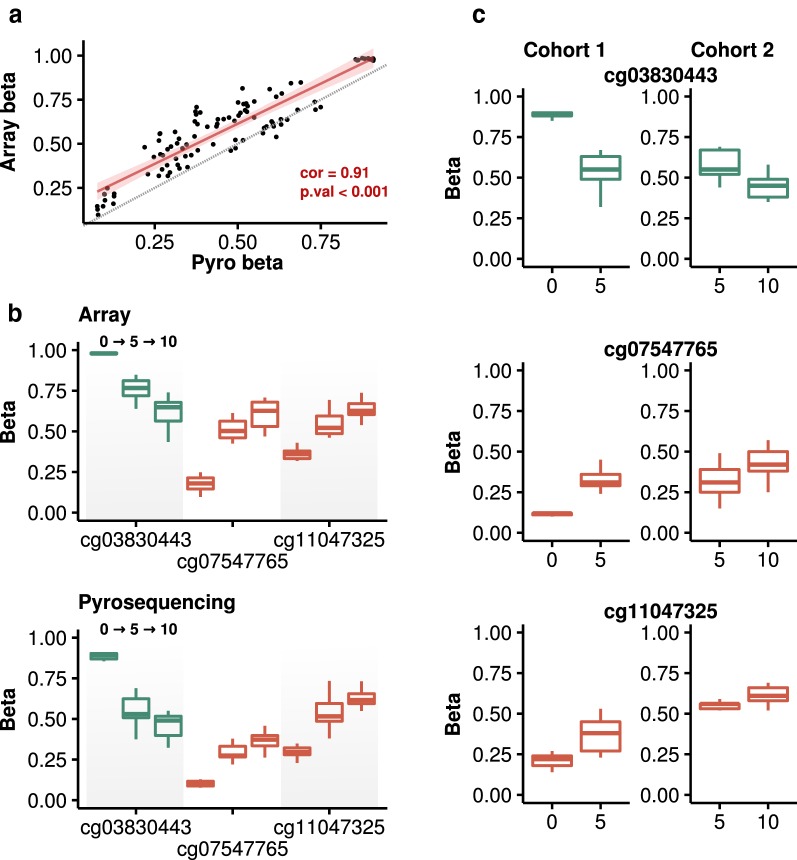
Fig. 5.
Technical and experimental validations. a Scatter plot showing the correlation between DNA methylation measurements performed by the Infinium MethylationEPIC BeadChip and by bisulfite pyrosequencing for 3 CpGs across the 11 subjects at the 3 time points (red, linear correlation estimation; grey, 1:1 line). b Box plots depicting the DNA methylation values of 3 CpGs measured by the Infinium MethylationEPIC BeadChip (top) and by bisulfite pyrosequencing (bottom). c Box plots indicating the DNA methylation values of the same 3 CpGs measured by bisulfite pyrosequencing in two independent cohorts, each comprising 9 children: measured (1) at 0 and 5 years of age and (2) at 5 and 10 years of age

