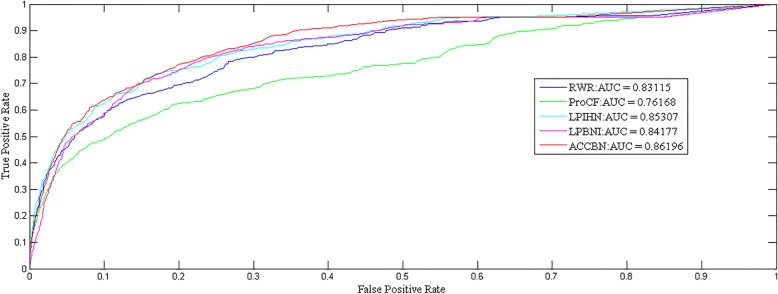
Fig. 3.
Performance comparison of different methods using ROC curves in predicting lncRNA–protein interactions Shown in the plot is the ROC for the whole dataset using RWR (blue, AUC: 0.83115), and ProCF (green, AUC: 0.76168),LPIHN (blue-green, AUC: 0.85307),LPBNI (purple, AUC: 0.84177), ACCBN(red, AUC: 0.86196), respectively

