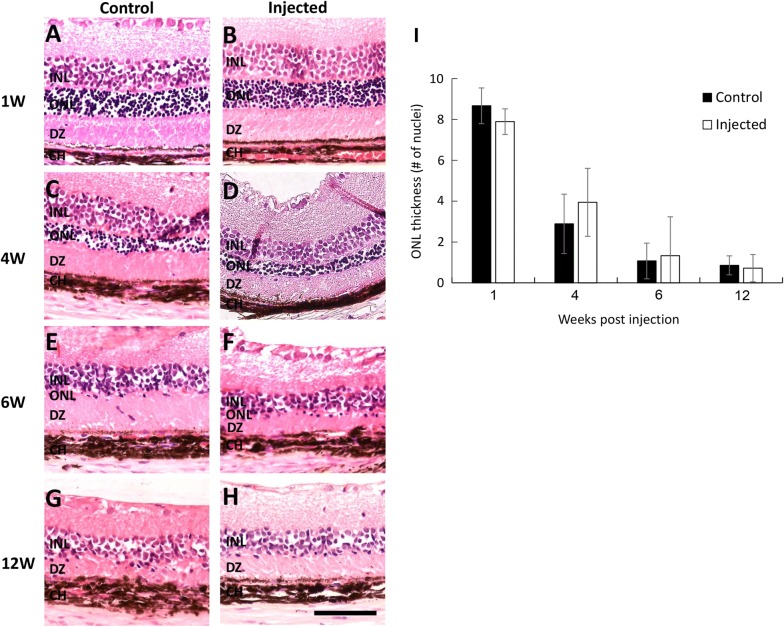
Fig. 3.
Histopathology analysis of RCS rat retinas. Representative images of retinal sections removed 1, 4, 6, and 12 weeks from non-injected (control, A, C, E, G) and contralateral injected eyes (B, D, F, H) stained with hematoxylin–eosin. Number of cell layers in ONL was evaluated by nuclei counting of 9 fields along the entire retina. Data is presented as mean ± SE from 2 to 4 eyes at each time point. Scale bar 100 μm

