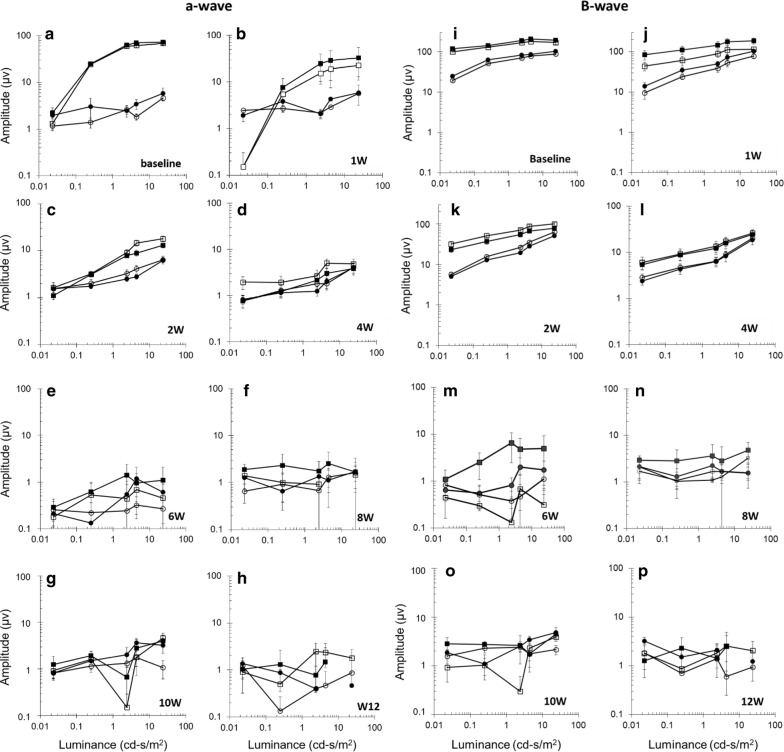
Fig. 4.
Electroretinogram recording showing retinal function in RCS rats following IO/HSA NP suprachoroidal injection. Dark-(squares) and light-(circles) adapted a-wave (a–h) and b-wave (i–p) amplitudes recorded in the injected (closed) and contralateral non injected control (open) eyes in the indicated time points following NP injection. Data are presented as mean ± SE

