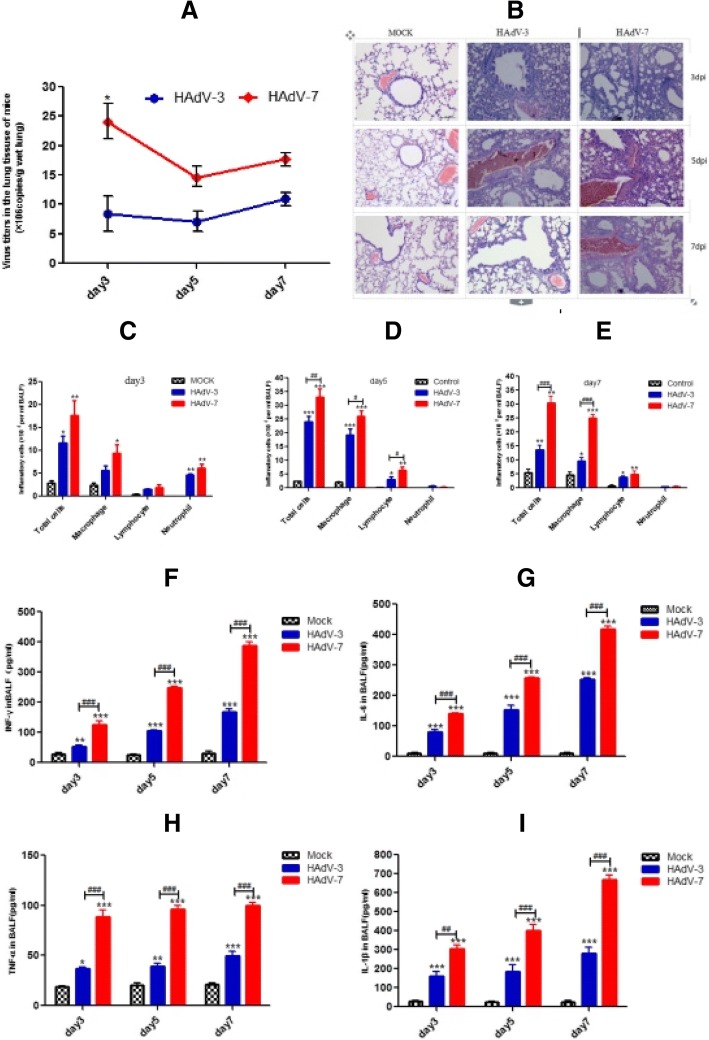
Fig. 4.
Difference of severity of pathology in mouse infected with HAdV-3 and HAdV-7. The viral load in lung homogenates, the inflammation and the number of infiltrated inflammatory cells in BALF at days 3, 5 and 7 post-infection are shown. a Viral load in the lung. b H&E staining of lung tissues (magnification 100x); c-e The number of total cells and the differential counting of cells in BALF. f-i Concentration of cytokine IL-1β, TNF-α, and IL-6 in BALF; n = 4; *,**,*** indicate P < 0.05, 0.01, and 0.001, respectively, compared with the mock group; #, ##, ### indicate P < 0.05, 0.01, and 0.001, respectively, compared with HAdV-3 group

