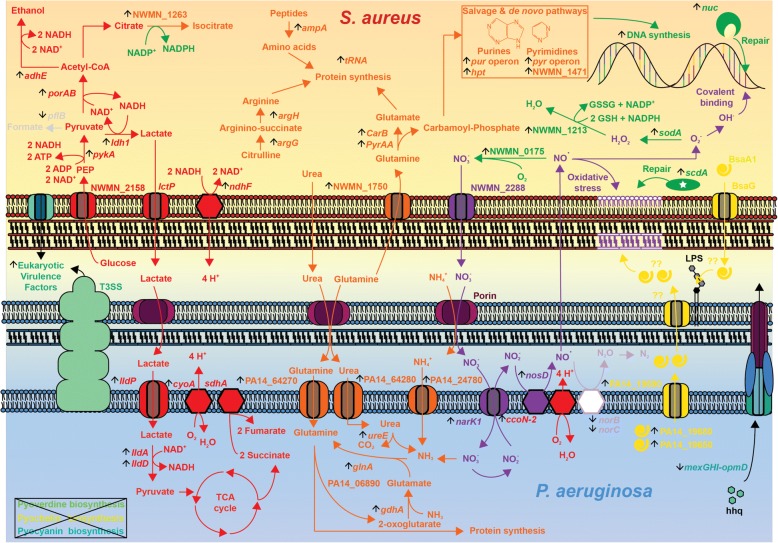
Fig. 5.
Schematic overview of the main reponses deduced by transcriptome analysis of P. aerugiosa and S. aureus after 3 h of co-culture. Vertical black arrows indicate genes up- or down-regulated in the presence of the competitor. Details are found in the text. Fold changes are reported in Tables 2 and 3 and in Additional file 3: Table S1 and Additional file 4: Table S2. Pathways involved in carbon and nitrogen metabolism affected in both organisms during the co-culture are shown in red and orange, respectively. Pathways affected in the co-culture and involved in the generation or in the response to oxidative stress are shown in green in S. aureus and in violet in P. aeruginosa. Induction of the holin/anti-holin like proteins (PA14_19680, PA14_19691) in P. aeruginosa are indicated in yellow (bottom right). After 3 h of co-culture, the synthesis of the siderophores pyoverdin and pyochelin as well as of the phenazines was strongly reduced in P. aeruginosa in response to S. aureus (box in the bottom left corner)

