
Fig. 6.
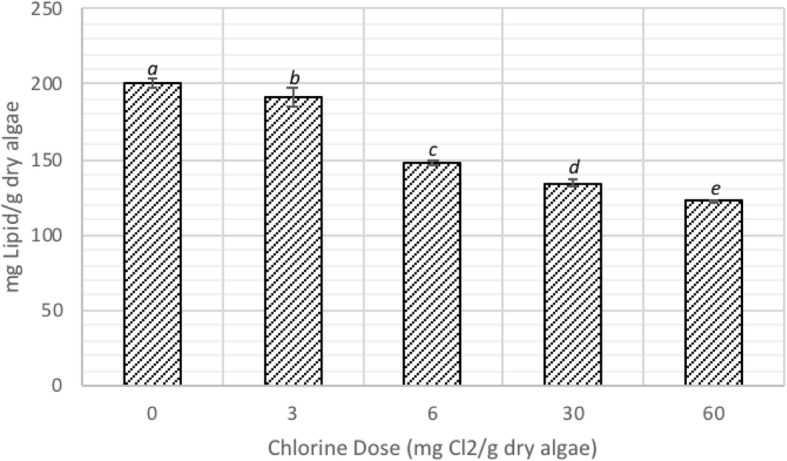
Lipid extraction yield with varying chlorine dose, and the results are presented as the means ± SD. Different italicized letters (a-e) indicate significant differences (P < 0.05)
Official websites use .gov
A
.gov website belongs to an official
government organization in the United States.
Secure .gov websites use HTTPS
A lock (
) or https:// means you've safely
connected to the .gov website. Share sensitive
information only on official, secure websites.
Lipid extraction yield with varying chlorine dose, and the results are presented as the means ± SD. Different italicized letters (a-e) indicate significant differences (P < 0.05)