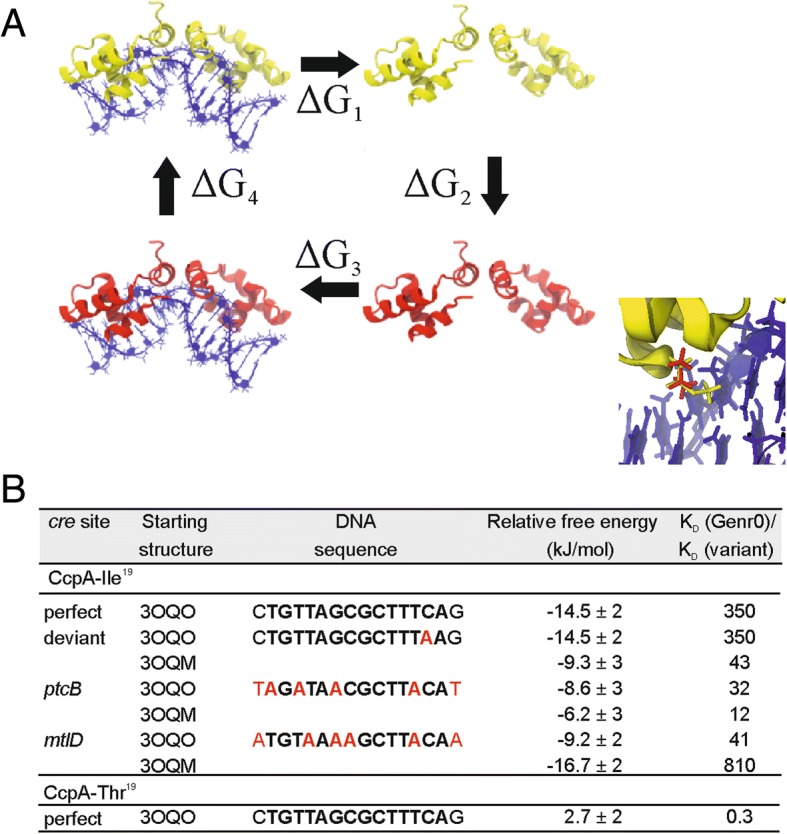
Fig. 7.

The thermodynamic cycle to calculate the relative binding free energies. The wild type protein is shown in yellow and the mutated protein in red (a). Note that while the color of the whole protein is different only a single residue is changed in both monomers of the mutated protein. The relative binding free energy is ΔG1 + ΔG3 which, based on the cycle, is equal to -(ΔG2 + ΔG4). The inset highlights the DNA binding domain of CcpA, with the methionine-19 position in red, and isoleucine at the same position in yellow. b Changes in relative binding free energy upon substitutions at Met19 in CcpA as calculated by molecular dynamics using two different starting structures i.e. 3OQO, with a synthetic cre site, and 3OQM, with the cre site from the ackA2 promoter region
