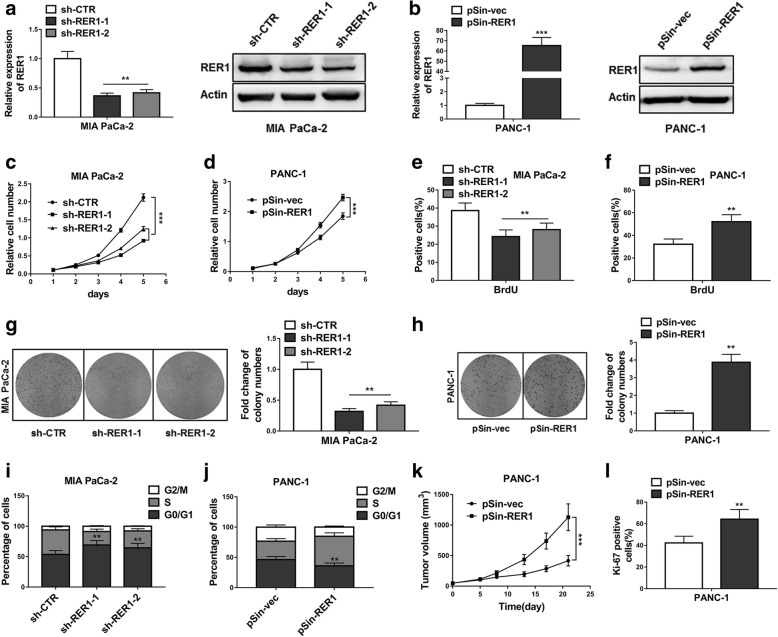
Fig. 2.
RER1 promotes oncogenicity of PC cells in vitro and in vivo. (a) Overexpression or knockdown of RER1 in Mia PaCa-2 cells were determined by qRT-PCR and Western blotting. (b) Overexpression or knockdown of RER1 in PANC-1 cells were determined by qRT-PCR and Western blotting. (c) CCK-8 assay showed cell survival of RER1 overexpression or knockdown Mia PaCa-2 cells. (d) CCK-8 assay showed cell survival of RER1 overexpression or knockdown PANC-1 cells (e and f) The percentages of BrdU positive Mia PaCa-2 and PANC-1 cells were determined. (g and h) Colony formation assay was conducted to assess cell survival of Mia PaCa-2 and PANC-1 cells (i and j) Cell cycle analysis of Mia PaCa-2 and PANC-1 cells were assessed by flow cytometry after staining with PI. The percentages of cells in three phases are shown in histogram. (k) Tumor growth curve of PANC-1-pSin-vec and PANC-1-pSin-RER1 cells implanted into the flank of male nude mice. (l) Cell proliferation was measured by Ki-67 staining assay. The data represent the mean ± SD from three independent experiments. *P < 0.05; **P < 0.01; ***P < 0.001 (Two-way ANOVA for c and d, student’s t-test for others)

