Fig. 2.
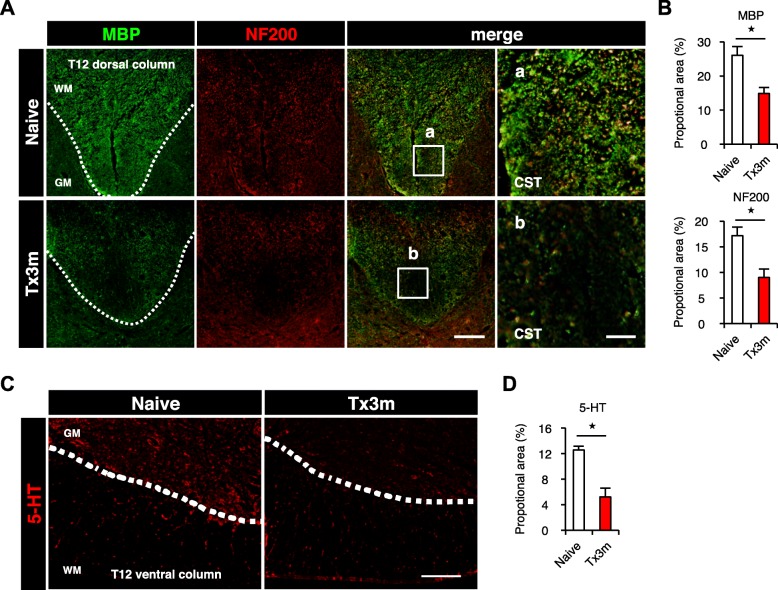
The number of neural fibers decreases in the spinal cord caudal to the lesion. a Immunohistochemistry for the corticospinal tract (CST) in the dorsal column of the lumbar spinal cord, stained for MBP (green) and NF200 (red). The rightmost images are magnifications of the boxed areas. b The ratio of MBP-positive area or NF200-positive area to transverse spinal cord area in the Naive and Tx3m groups (n = 5 mice per group). c Immunohistochemical analysis of serotonergic neural fibers in the ventral horn of the lumbar spinal cord, stained with 5-HT (red). d The ratio of 5-HT-positive area to transverse spinal cord area in the Naive group and in the Tx3m group (n = 4 mice per group). *P < 0.05, n.s. = not significant (P > 0.05), Wilcoxon rank sum test (b and d). Data are presented as the mean ± SEM. Scale bars: 50 μm (a, left three panels); 10 μm (a, right panels); 100 μm (c)

