
Fig. 2.
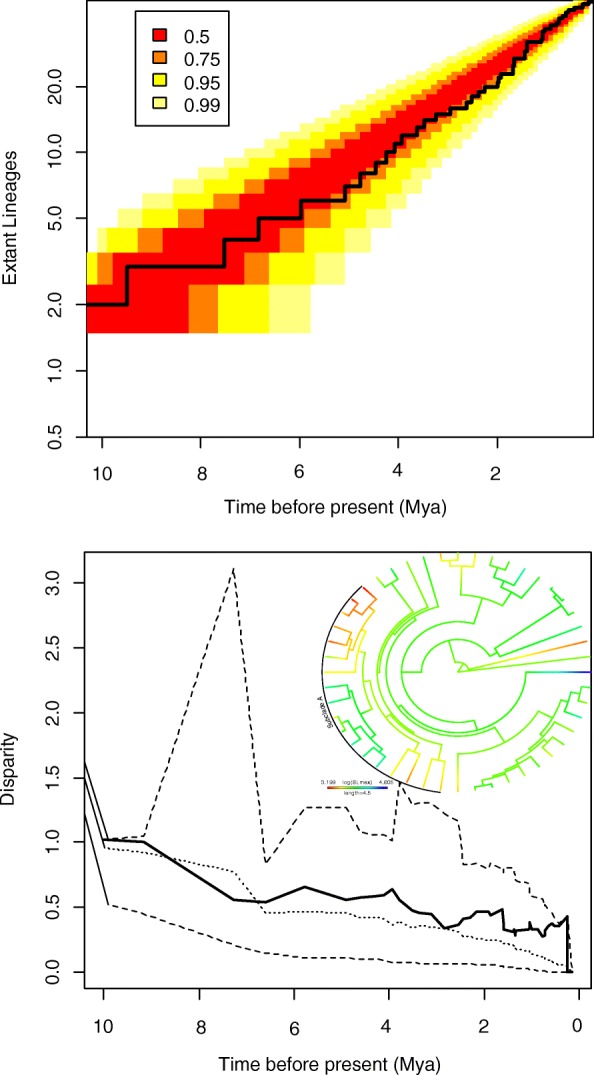
Top, lineage-through-time (LTT) accumulation curve for Nothobranchius radiation (black line). Unit of time (x-axis) is in millions of years before present (Mya). Coloured area represents confidence intervals for pure-birth model. Confidence intervals range from 50% (0.5) to 99% (0.99). Bottom, disparity-through-time (DTT) for body size (solid line), against a Brownian motion null model (dotted line). Area within dashed lines is the confidence intervals at 95%. Time before present in in millions of years before present. Inset in the DTT plot is the Brownian motion reconstruction of body size across each lineage with subclade A labelled