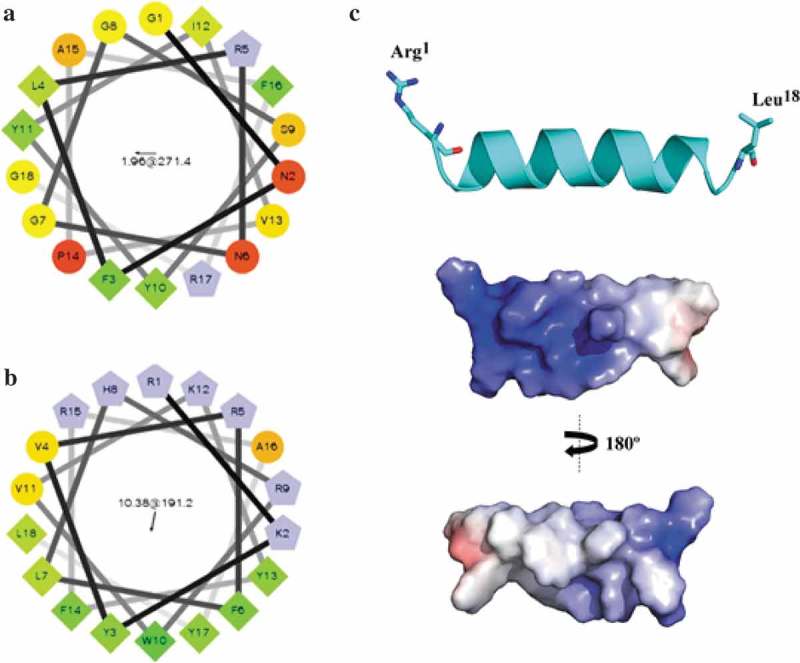
Figure 1.

The arrangement of adevonin. Helical wheel diagrams for the original peptide and adevonin. The original AMP obtained from ApTI (a) and the rationalized AMP, adevonin (b), are shown. Hydrophilic residues were shown as circles; hydrophobic residues as diamonds; potentially negatively-charged residues are shown as triangles and positively-charged residues are shown as pentagons. The most hydrophobic residue is green and the amount of green decreases proportionally with hydrophobicity, with the yellow color indicating zero hydrophobicity. The hydrophilic residues are encoded in red, with pure red representing the greatest hydrophilicity (uncharged) and the shade of red decreasing in proportion to hydrophilicity. Potentially charged residues are in light blue. The arrows inside the diagram represent the hydrophobic moment of the peptides. Diagrams were built using the server Helical Wheel Projection (http://rzlab.ucr.edu/scripts/wheel/wheel.cgi). (c) Lowest free energy theoretical model for the adevonin peptide. Adaptive Poisson-Boltzmann Solver (APBS) electrostatic potential of peptide adevonin; potential ranges from – 5 kT/e (red) to + 5 kT/e (blue).
