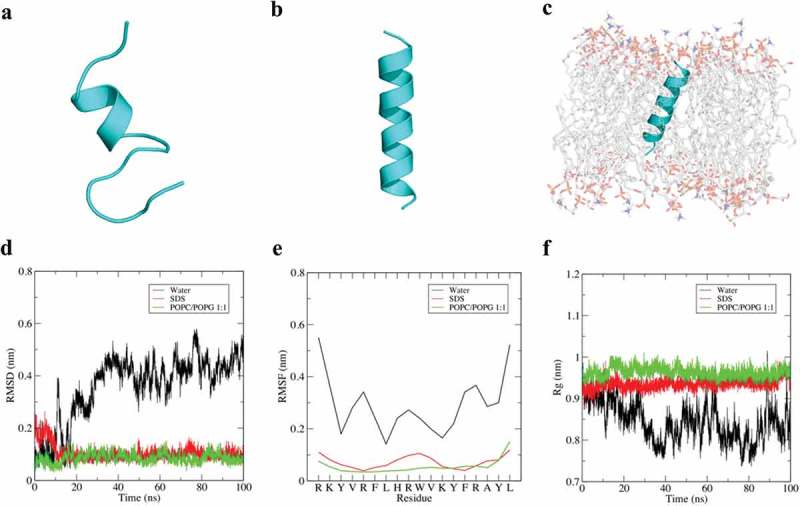
Figure 3.

Dynamic simulation of adevonin in different environments. Structural snapshots of adevonin in water (a), SDS (b) and POPC/POPG 1:1 (c) after 100 ns of MD simulation. The MD analyzes, including root mean square deviation (RMSD) (d), root mean square fluctuation (RMSF) (e) and radius of gyration (Rg) are also shown. N-terminus is always at the top.
