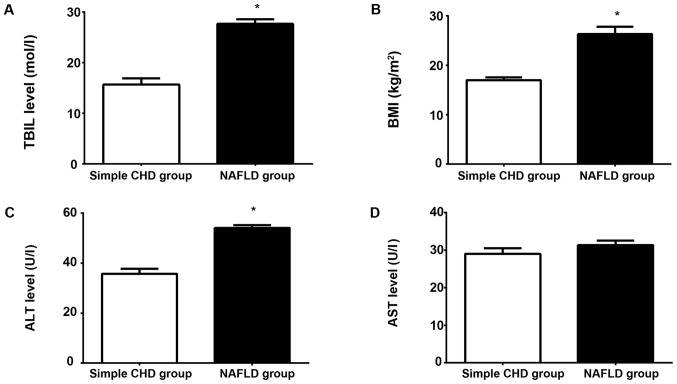
Figure 2.
Comparison of general conditions and liver function between the two groups: (A-C) the serum TBIL and ALT levels and BMI in the NAFLD group were significantly higher than those in the simple CHD group, and the differences were statistically significant (*P<0.05). (D) There was no statistically significant difference in the serum AST level between the two groups (P>0.05). TBIL, total bilirubin; ALT, alanine aminotransferase; BMI, body mass index; NAFLD, non-alcoholic fatty liver disease; CHD, coronary heart disease; AST, aspartate aminotransferase.

