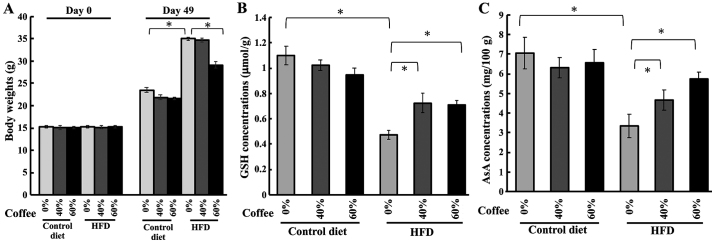
Figure 2.
Measurement of body weight, and lens GSH or AsA level in HFD-treated mice with various concentrations of coffee brew. (A) Body weights of HFD-fed mice with various concentrations of dark-roasted coffee brew on day 0 and 49. Several concentrations of coffee brew were administered to HFD-fed mice and the levels of (B) GSH and (C) AsA were measured in the lens. All results are expressed as the mean ± standard error of the mean. Triplicate determinations were performed in each experiment (n=6 in each group). *P<0.05. HFD, high-fat diet; GSH, glutathione; AsA, ascorbic acid.

