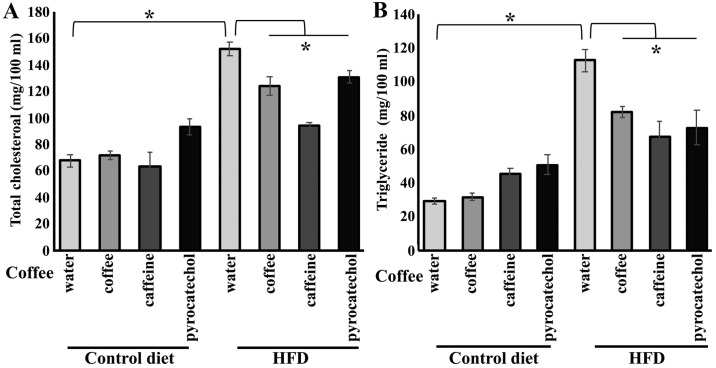
Figure 4.
Levels of total cholesterol and triglycerides in HFD-fed mice treated with each coffee component. After seven weeks of HFD or control diet feeding, blood was collected and plasma samples were separated by centrifugation (A) Total cholesterol levels of HFD-fed mice treated with coffee components. (B) Triglyceride levels in plasma. All results are expressed as the mean ± standard error of the mean (n=6 in each group). *P<0.05. HFD, high-fat diet.

