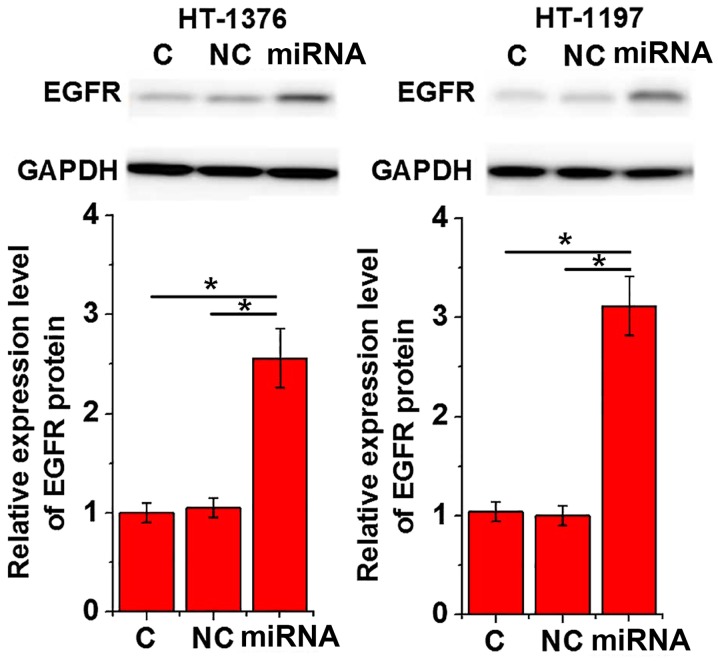
Figure 4.
Effects of miRNA-373 overexpression on EGFR expression. The upper panel demonstrates representative western blot analysis results. The lower panel represents EGFR expression normalized to endogenous control GAPDH. This experiment was performed in triplicate and all data are expressed as mean ± standard deviation. *P<0.05. miRNA, microRNA; siRNA, small interfering RNA; EGFR, epidermal growth factor receptor; C, control cells without transfection; NC, negative control cells transfected with negative control miRNA; Mimic, cells transfected with microRNA-373 mimic.

