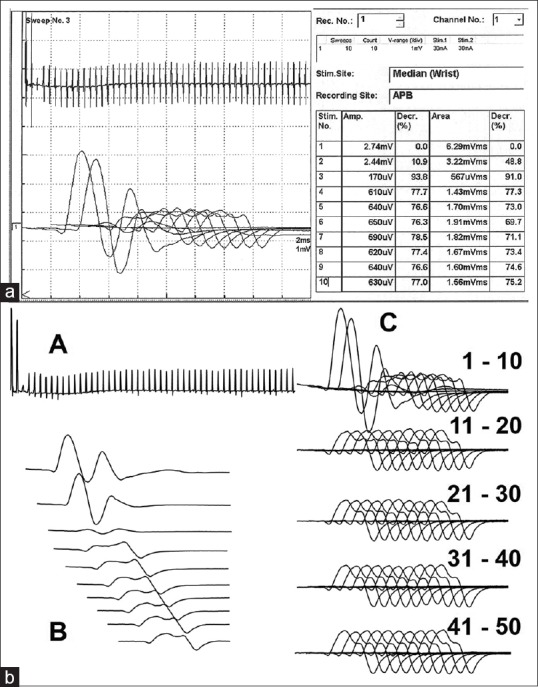
Figure 2.

Decrement–increment phenomenon at 30Hz stimulation. (a) Marked decrement of the compound muscle action potential amplitude and (b) Amplitude graph of 50 stimuli (A), Individual 1st ten stimuli (B), and set of ten responses from first to the fiftieth stimulus (C)
