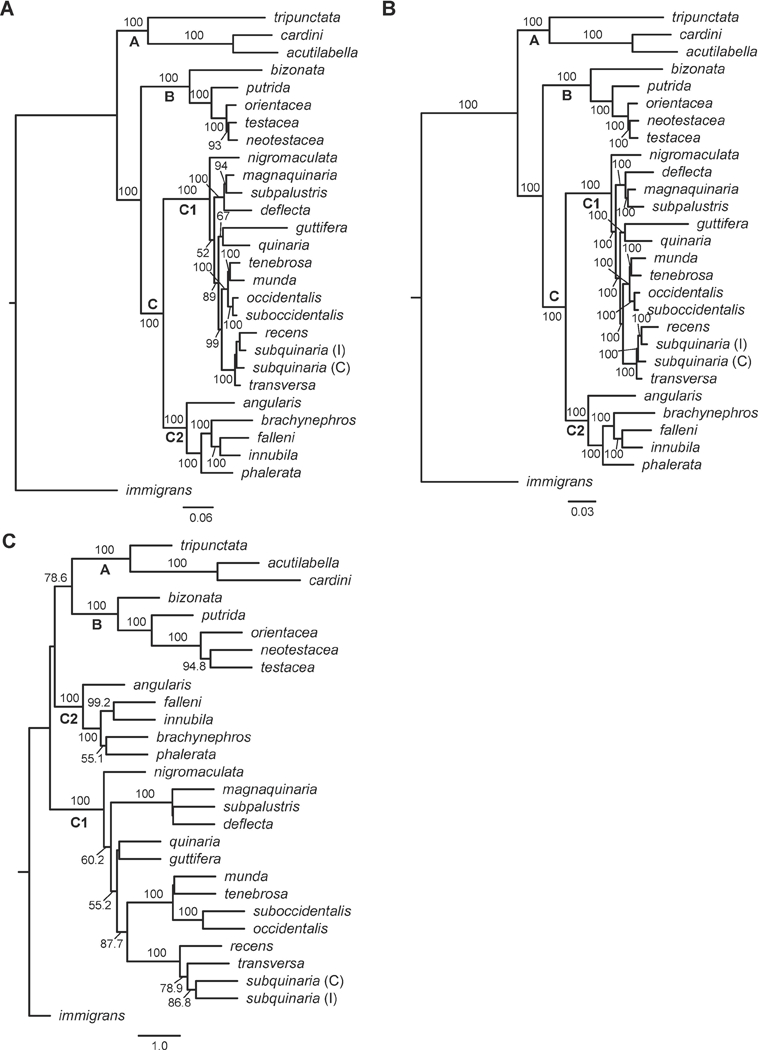
Figure 1.

Comparison of phylogenetic relationships within the quinaria and testacea groups using the entire dataset of 43 loci. (A) Analyses of the concatenated dataset using maximum likelihood. Shown is the most likely cladogram, with a LnL = −111850.75. BS ≥ 50 is given above branches; (B) Analyses of the concatenated dataset using Bayesian inference. Shown is the most probable topology, with a Harmonic Mean = −108525.50. PP is given above the branches; (C) The species tree resulting from the ASTRAL analysis of all 43 gene trees, with BS ≥ 50 given above branches. All analyses were rooted with D. immigrans. Clade A represents the tripunctata and cardini group species; Clade B represents the testacea and bizonata group species, and Clade C represents the quinaria group species, with C1 and C2 representing the two divergent clades within this group. Within D. subquinaria, the Coastal and Inland samples are designated by C and I, respectively.
