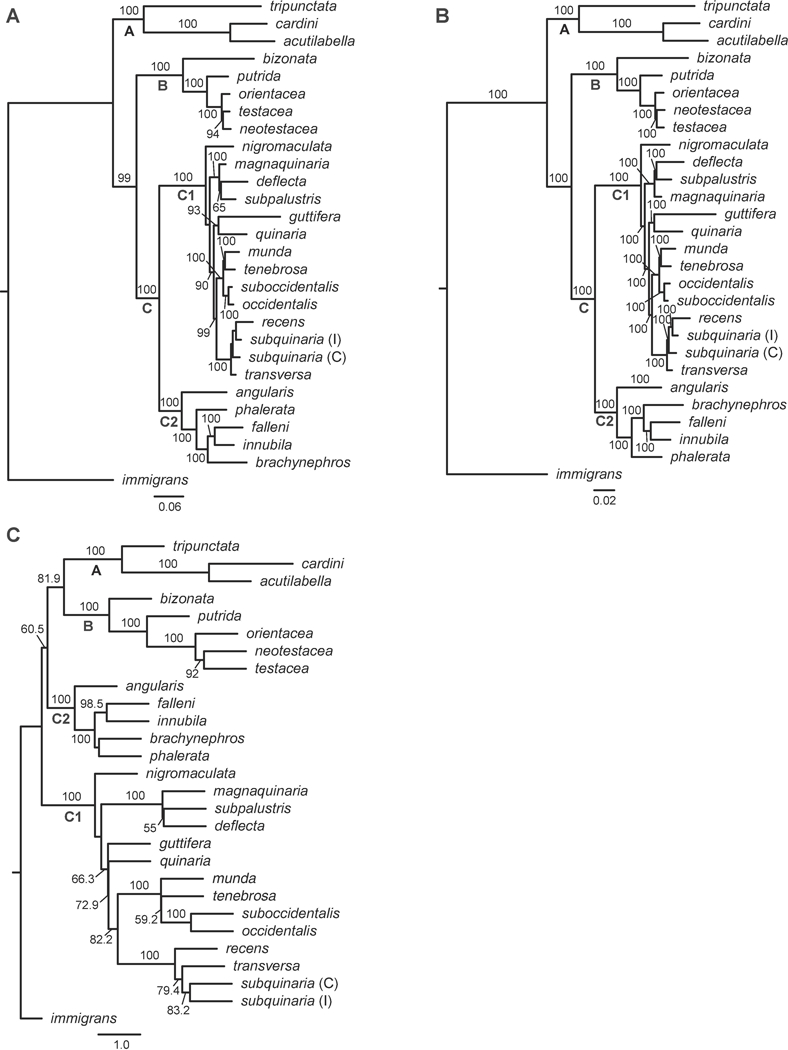
Figure 2.

Phylogenetic relationships within the quinaria and testacea groups resulting from the analyses of 40 nuclear loci. BS ≥ 50 are given above branches. (A) Analyses of the concatenated dataset using maximum likelihood. Shown is the most likely cladogram, with a LnL = −102720.99. BS ≥ 50 is given above branches; (B) Analyses of the concatenated dataset using Bayesian inference. Shown is the most probable topology, with a Harmonic Mean = −99861.12. PP is given above the branches; (C) The species tree resulting from the ASTRAL analysis of all 40 gene trees, with BS ≥ 50 given above branches. As in Fig. 1, Clade A represents the tripunctata and cardini group species; Clade B represents the testacea and bizonata group species, and Clade C represents the quinaria group, with C1 and C2 representing the two divergent clades within this group. Within D. subquinaria, the Coastal and Inland samples are designated by C and I, respectively.
